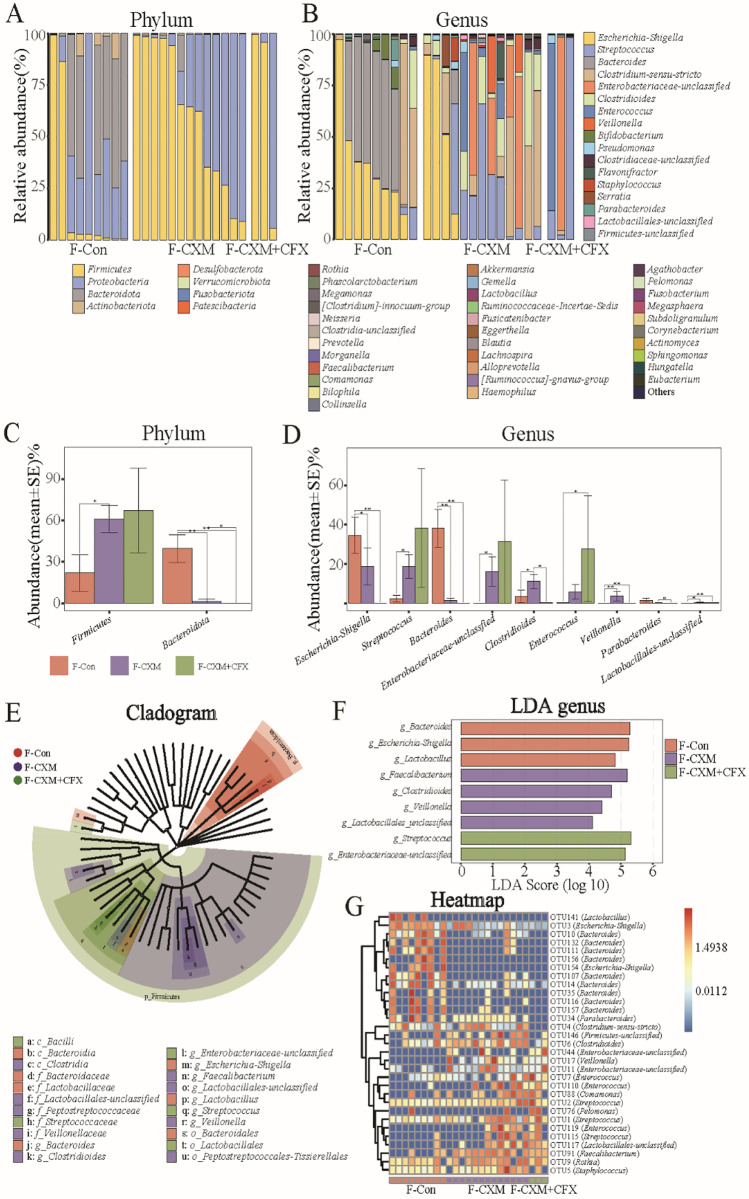
Fig. 4.
Comparison of the gut microbiota in fecal samples from the F-Con group (n = 9), F-CXM group (n = 13), and F-CXM + CFX group (n = 3). A and B Microbial community bar plot of the gut microbiota in fecal samples at the phylum and genus levels; C and D Kruskal–Wallis rank-sum test of the gut microbiota abundance in fecal samples at the phylum and genus levels; E LEfSe analysis cladogram of distinct bacteria in fecal samples at the phylum level; F LDA score of distinct bacteria in fecal samples at the genus level; G microbial community heatmap regarding the gut microbiota abundance in fecal samples. Red cells indicate increased; blue cells indicate decreased

