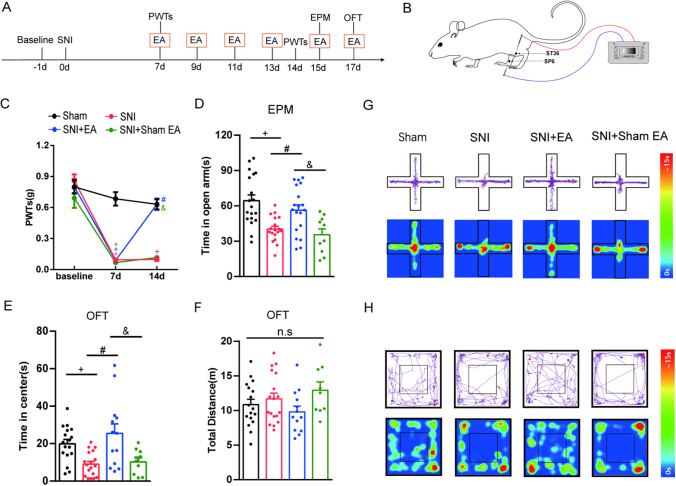
Fig. 1.
The effect of EA on the PWTs and anxiety-like behaviors in SNI mice. A Schematic of the experimental procedure. B Schematic of EA stimuli at acupoint sites ST36 and SP6 in SNI mice. C The effect of bilateral EA stimulation with 100 Hz on the PWTs. (n = 10–19 per group). D–F The effect of bilateral EA stimulation at 100 Hz on anxiety-like behaviors in the EPM (D) and OFT (E–F). (n = 9–19 per group). G Diagram showing representative movement and activity heatmaps in the EPM. H Diagram showing representative movement and activity heatmaps in the OFT. Data are expressed as the mean ± SEM. Tukey’s post hoc test: + p < 0.05 vs. the sham group; #p < 0.05 vs. the SNI group; &p < 0.05 vs. the SNI + sham EA group

