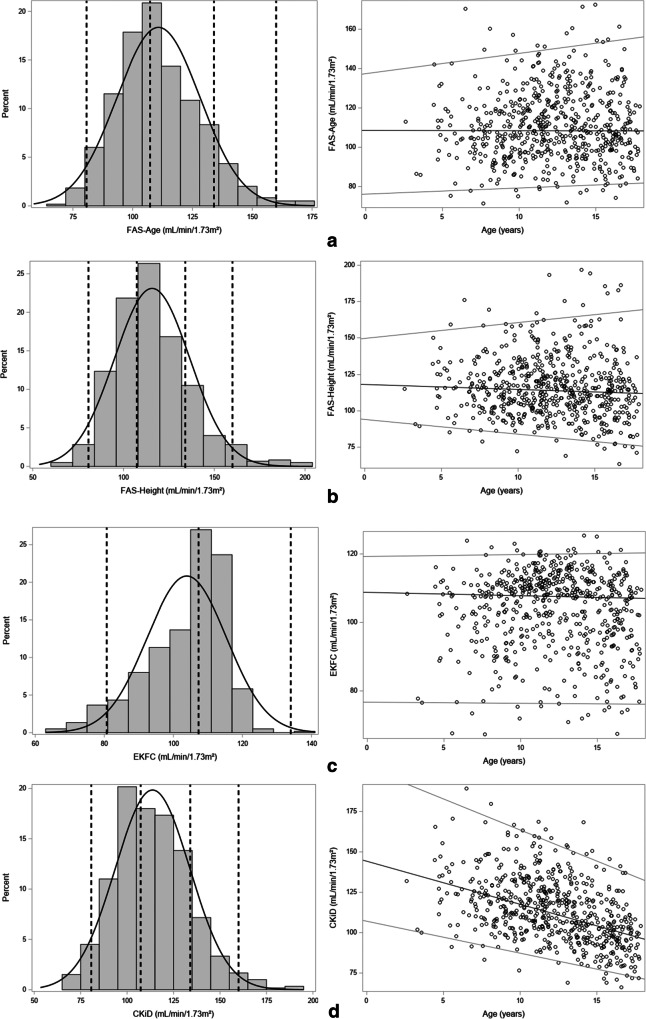
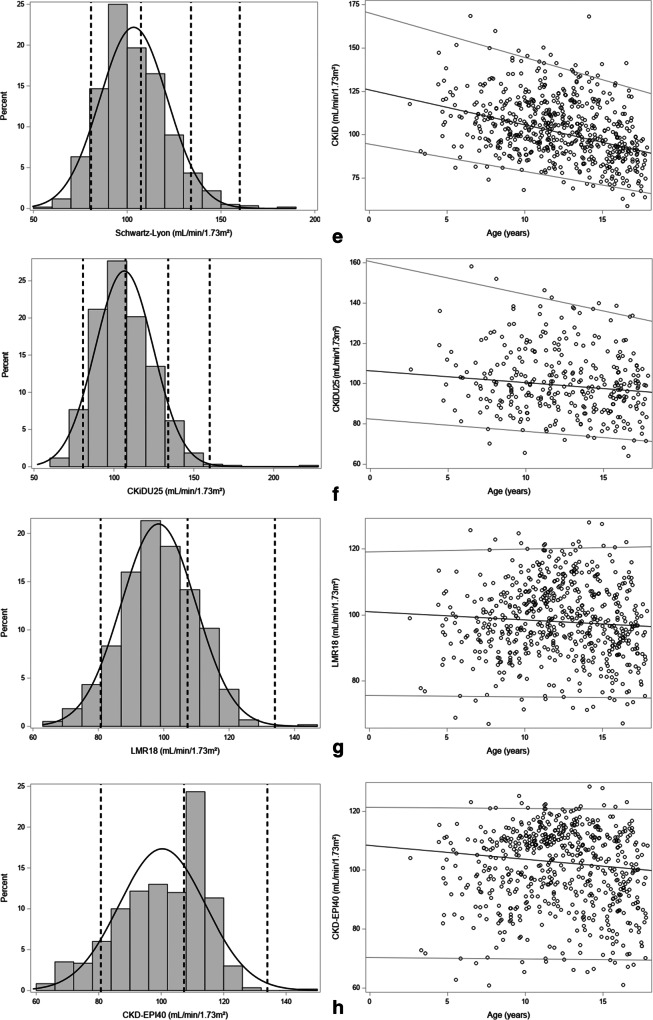
Fig. 4.
Histograms and linear quantile regression of eGFR FAS age (a); FAS height (b); EKFC (c); CKiD (bedside Schwartz) (d); Schwartz-Lyon (e); CKiDU25 (f); LMR18 (g); CKD-EPI40 (h). The vertical lines in the histograms correspond to 80.7 (lower limit), 107.3 (median), 133.9 (= symmetrical to 80.7), and 160.1 (upper limit) corresponding to the FAS-eGFR limits calculated from SCr/Q = 0.67, 1, and 1.33 as defined by Pottel et al. [21]


