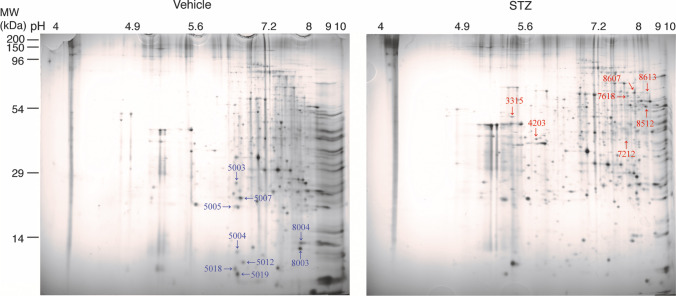
Fig. 5.
A representative 2-DE gel image of cortical proteins from vehicle- and STZ-treated mice. Cortical proteins obtained from vehicle- and STZ-treated mice were loaded on a pH 4–10, non-linear gel strip for isoelectric focusing and separated using SDS-PAGE. Spots were visualized by Coomassie G250 staining. The blue arrows and numbers indicate downregulated proteins, while the red arrows and numbers indicate upregulated proteins in STZ-treated mice compared with vehicle controls. The spots were selected and identified by LC–MS/MS analysis

