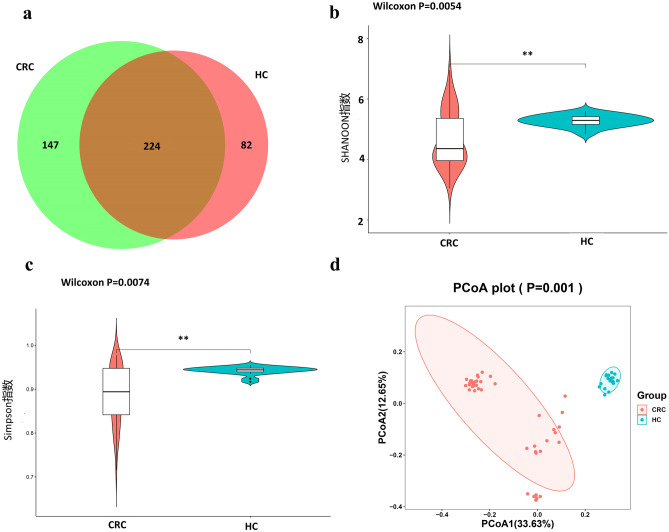
Fig. 2.
Alterations of fecal bacterial microbiota profile. a Venn diagram intuitively presents the number of the common and exclusive OTUs between the CRC and the HC group calculated through R software. b The boxplot of Shannon index shows the difference in OTU diversity between the CRC and the HC group (p = 0.0054). c The boxplot of Simpson index shows the difference in OTU diversity between the CRC and the HC group (p = 0.0074). d PCoA using Bray–Curtis of beta diversity in CRC and HC groups. CRC, colorectal cancer; HC, healthy controls

