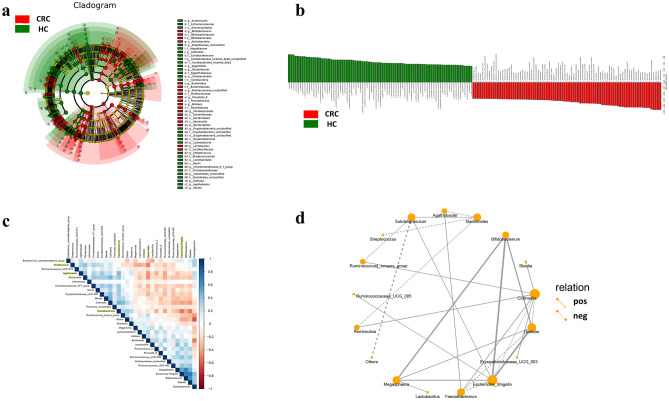
Fig. 4.
Difference of fecal microbiota in CRC patients and HC. a Different circle layers radiate from the inside to the outside to represent the seven classification levels of genus and species of the family phylla and each node represents a species classification at that level. The higher the species abundance, the more nodes are present. Yellow colored nodes indicate species showing no significant difference to the comparison group; red nodes indicate species with significant differences and a higher abundance compared to the reference group; green nodes indicate species with significant differences and a lower abundance compared to the reference group. b LDA score computed from features differentially abundant in CRC and HC fecal samples. The criteria for feature selection were LDA score > 4, p < 0.05, Green and red represent the HC group and CRC group, respectively. c Spearman correlations on the genus level by calculating the microbial abundance of the Top30. Red dots indicate a negative correlation, blue dots indicate a positive correlation, a cross indicates no significant difference (P > 0.05). d Interaction network on the genus level by calculating the microbial abundance of the Top30. Solid lines indicate a positive correlation and dotted lines indicate a negative correlation. The thickness of the line represents the association strength. Each dot represents the relative abundance of the species

