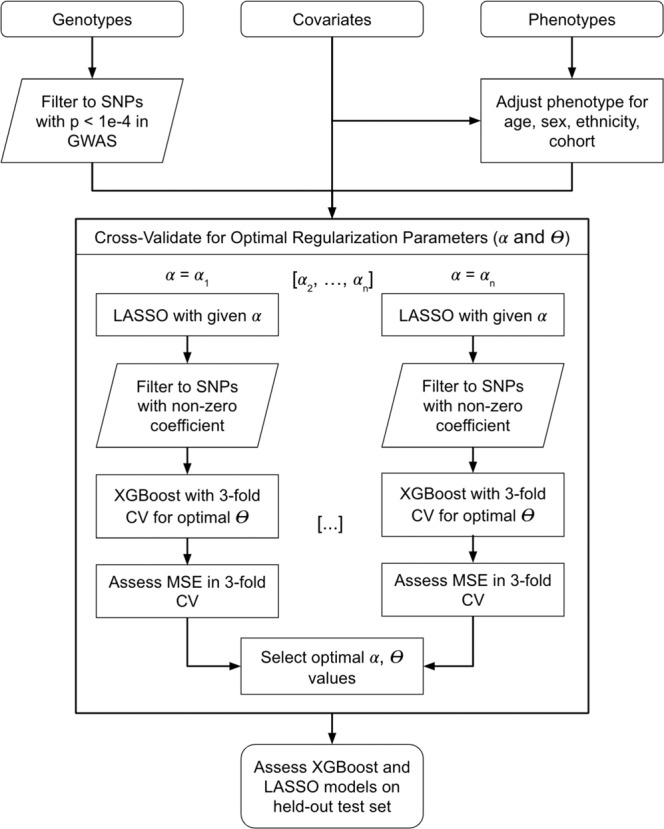
Fig. 2. Flow chart of ensemble model structure.

The model relies on jointly training the LASSO and XGBoost model to identify the optimal value for the L1 regularization parameter and the number of boosting steps. CV indicates cross-validation, α refers to the regularization parameter, and Ɵ is the number of boosted trees for XGBoost. The optimal values for these hyperparameters were selected using threefold CV for the mean squared error of the XGBoost model.
