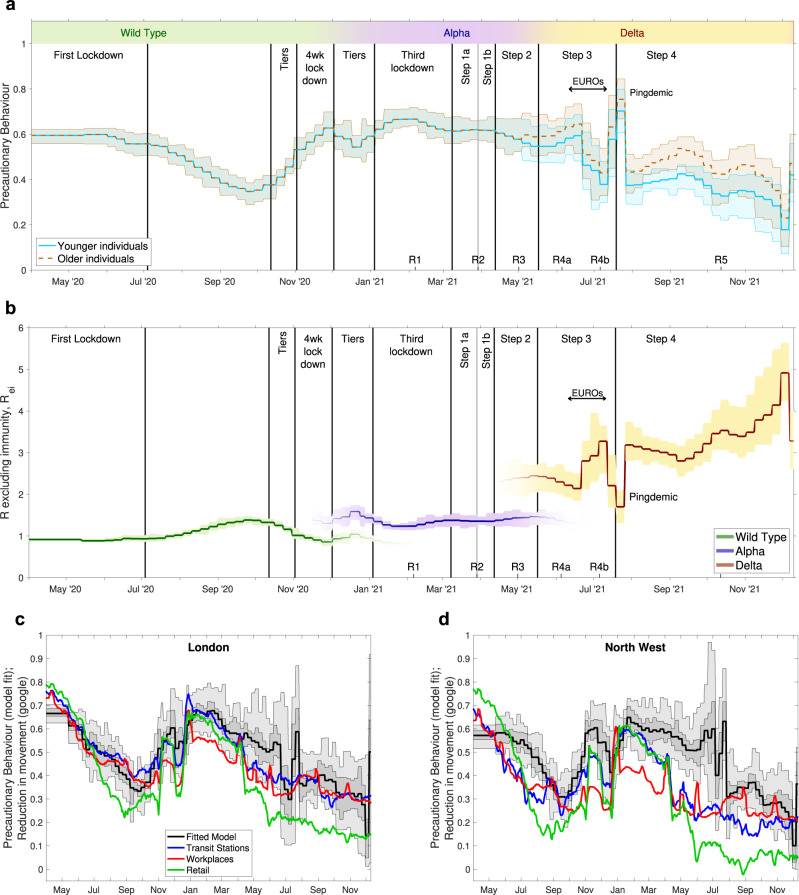
Fig. 1. Changes in the inferred dynamics over time.
a The inferred precautionary behaviour in England from April 2020 to December 2021; younger individuals are under 40, older individuals are over 65, while those in between are a linear extrapolation. b The resultant changes to R excluding immunity for the three main variants. c, d A comparison between fitted precautionary behaviour and Google movement records27 in two NHS regions. Vertical lines indicate the time of key changes to the control measures. Labels are key moments from the pandemic in England: Lockdowns are nationwide restrictions on movement and social mixing; Tiers are localised restrictions of varying degrees; Steps are as described throughout this document; EUROS are the UEFA European Football Championships that led to substantially increased levels of social mixing; while the Pingdemic is a period when there was a vast increase in mobile-phone App alerts due to high levels of cases and more frequent social mixing. The dates of the six Roadmaps (R1-R5) are marked on the lower axes. In all panels the bold lines are mean values; in the top two panels a, b, the shaded area represents the 95% credible interval, whereas in the bottom panels both the 50% (dark grey) and 95% (lighter grey) intervals are shown.

