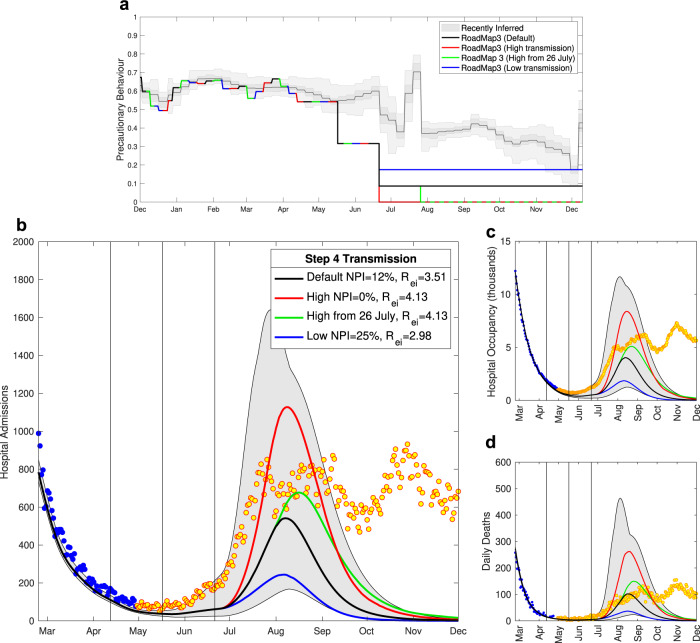
Fig. 5. Severe disease projections from Roadmap 3 Figure 1015, which considered the impact of social mixing and hence transmission in Step 4.
a The most recently inferred level of precautionary behaviour (grey, showing mean, 50% and 95% credible intervals) together with the assumed default levels from Roadmap 315. Lower panels show projected level of daily hospital admissions b, hospital occupancy c and daily deaths d together with the associated data until December 2021; data points from before the Roadmap and used in parameter inference are in blue, those after the Roadmap are in orange. Lines are the median values, while the shaded region correspond to the 95% prediction interval for the default model (black); vertical lines correspond to the expected date of Steps 2, 3 and 4 on 12th April 2021, 17th May 2021 and 21st June 2021.

