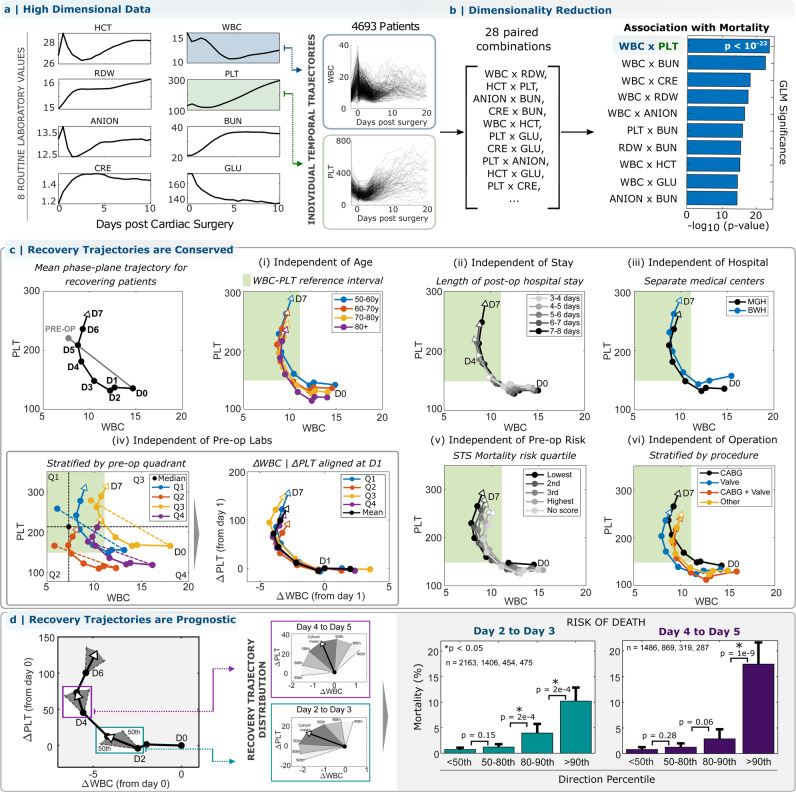
Fig. 1. Analysis of the acute inflammatory response to non-emergency cardiac surgery in the WBC-PLT phase plane reveals a consistent shape of recovery.
a High-dimensional trajectories of routine cellular and serum markers following cardiac surgery are associated with patient outcome. b Trajectories retain association in reduced dimensions, with WBC-PLT as the 2D combination most strongly associated with outcomes. c The average patient with a good recovery (surviving, LOS < 14 days) follows a consistent recovery trajectory in the WBC-PLT phase-plane, which persists independent of (i) age, (ii) length of stay, (iii) medical center, (iv) pre-op marker values, (v) pre-op risk defined by the STS risk score15, (vi) surgery sub-type, and gender and surgery year (Supplementary Fig. 4). d Deviation from the mean recovery trajectory is associated with adverse outcomes in retrospective analysis. The mean trajectory along with the 50th, 80th, and 90th percentiles for daily directional changes are shown. Directional deviation from the mean trajectory is associated with significant (star: *p < 0.05) increased mean mortality for patients above the 90th percentile compared to those below the 50th: 14x (CI 8.0–24.1, 0.7–10.2%, two-sided chi-squared test, : 150, p = 1e−16, df = 1) on day 3 after surgery and 22x (CI: 11.7–39.8, 0.8–17.4%, two-sided chi-squared test, : 177, p = 1e−16, df = 1) on day 5 (error bars denote 95% CI on the mean). Circles in panels (d) denote 1-day time intervals, or from pre-op to immediately post-op. See Supplementary Fig. 12 for trajectories for alternate test result pairs. Trajectories for WBC lineages (neutrophils, lymphocytes, etc.) are shown in Supplementary Fig. 14. See Supplementary Movie 1 for a video animation of recovery trajectories from (c), iv. Source data are provided as a Source data file. HCT: hematocrit, WBC: white blood cell count, RDW: red cell distribution width, PLT: platelet count, ANION: anion gap, BUN: blood-urea nitrogen, CRE: creatinine, GLU: glucose, MGH: Massachusetts General Hospital, BWH: Brigham and Women’s Hospital.

