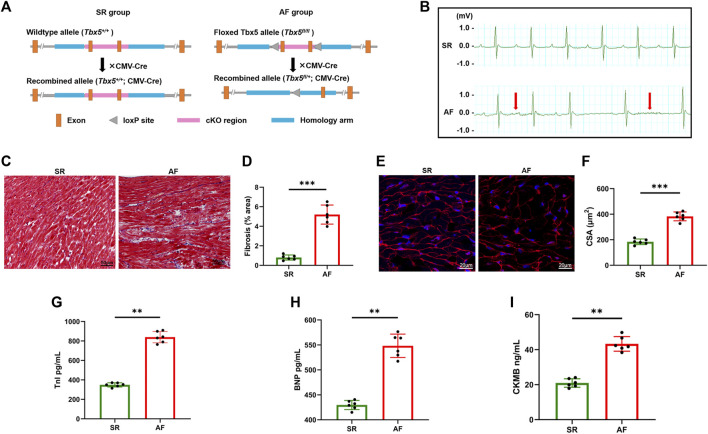
FIGURE 1.
Histological and cellular changes in the hearts of atrial fibrillation mouse models. (A), Experimental schema of AF mice model. Male Tbx5 +/− mice (Tbx5 fl/+ ; CMV-Cre) and CMV-Cre mice were used as SR and AF mice respectively. (B) ECG tracing of SR mice (upper) and AF mice (lower); rapid and irregular atrial waves are indicated by red arrows. (C) Histological images of hearts from SR and AF mice obtained by Masson’s trichrome staining. Scale bar: 100 μm (right panel). (D) The degree of fibrosis was evaluated and calculated by measuring the blue regions (collagen) relative to the total tissue area in sections, as shown in (C). (E) Representative images stained with WGA (red) to delineate the sarcolemma, and DAPI (blue). Scale bar, 20 μm. (F) Quantification of the CSAs of atrial cardiomyocytes. (G–I) Statistics of plasma concentrations of BNP, TnI, and CK-MB in mice in two groups. AF, atrial fibrillation; SR, sinus rhythm; ECG, electrocardiogram; WGA, wheat germ agglutinin; CSA, cross-sectional area; BNP, brain natriuretic peptide; TnI, troponin I; CK-MB, creatine kinase MB.

