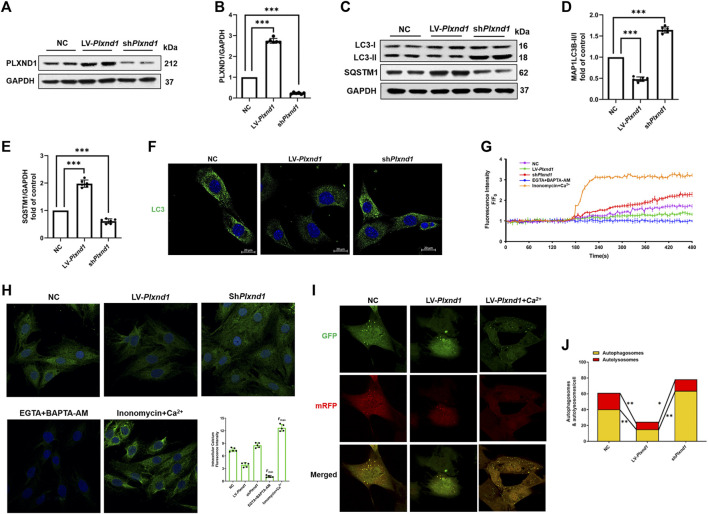
FIGURE 3.
PLXND1 inhibits autophagy via intracellular calcium signaling. Mouse EECs were treated with NC, LV-Plxnd1, and shPlxnd1. (A) Representative WB of PLXND1 in EECs subjected to the indicated treatments. (B) Quantitative analysis of the efficacy of overexpression and knockdown of Plxnd1. (C) Representative western blots of autophagic markers in EECs subjected to the indicated treatments. (D–E) Quantitative analysis indicates that PLXND1 significantly affects the level of autophagy. (F) Immunofluorescence staining was used to detect MAP1LC3B in EECs. Scale bar: 20 μm. (G) Intracellular calcium was marked by the Fluo-3-AM probe and measured continuously for 8 min (H) EECs were incubated with the calcium probe Fluo-3-AM. EGTA + BAPTA-AM was used to obtain the minimum fluorescence intensity (Fmin), whereas ionomycin + calcium was used to obtain the maximum fluorescence intensity (Fmax). Scale bar: 20 μm. Quantitative analysis showed the fluorescence intensity in the different groups. (I-J) EECs were infected with a tandem GFP-mRFP-LC3 adenovirus for 24 h. Representative merged images (I) and quantitative analysis (J) of yellow and free red puncta in merged images of different treatment groups. Scale bar: 10 μm. EECs, endocardial endothelial cells; NC, negative control; PLXND1, plexinD1; WB, western blotting; EGTA, ethylene glycol tetraacetic acid.

