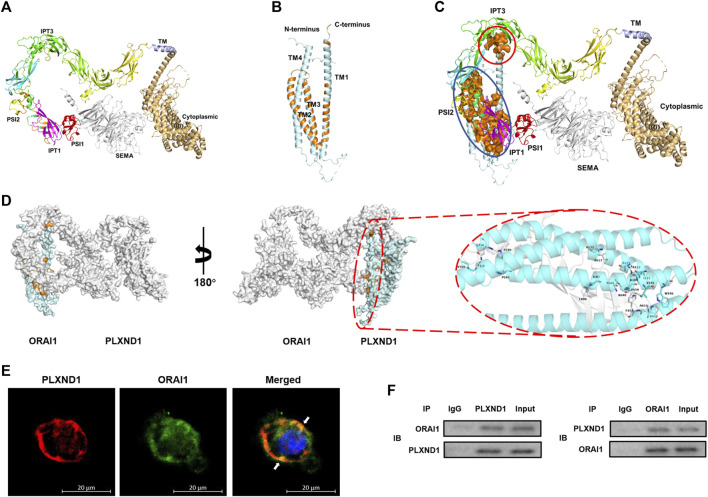
FIGURE 4.
PLXND1 binds to ORAI1 in endocardial endothelial cells to regulate intracellular calcium levels. (A–B) Structure of predicted PLXND1 (A) and ORAI1(B). The elements of secondary structure (α-helices and β-sheets) are represented by different colors. (C) Schematic visualization of the PLXND1-ORAI1 complex, and the coupling regions were marked by red and blue solid circle respectively. (D)Three-dimensional structure showing PLXND1-ORAI1 in (C). PLXND1 and ORAI1 are represented as the grey and blue ribbon respectively. A view rotated 180° about the y axis is shown with the enlargement of interact surface in red solid circle (right). (E) Immunofluorescent staining was applied to mark PLXND1 (red) and ORAI1 (green) in EECs. White arrows represent their colocalization on the EECs. Scale bar: 20 μm. (F) Lysates from EECs were subjected to IP with IgG, anti-PLXND1, or anti-ORAI1 antibody, followed by western blotting for PLXND1 and ORAI1. PLXND1, plexinD1; EECs, endocardial endothelial cells; IP, immunoprecipitation; IB, immunoblotting; NC, negative control; WB, western blot.

