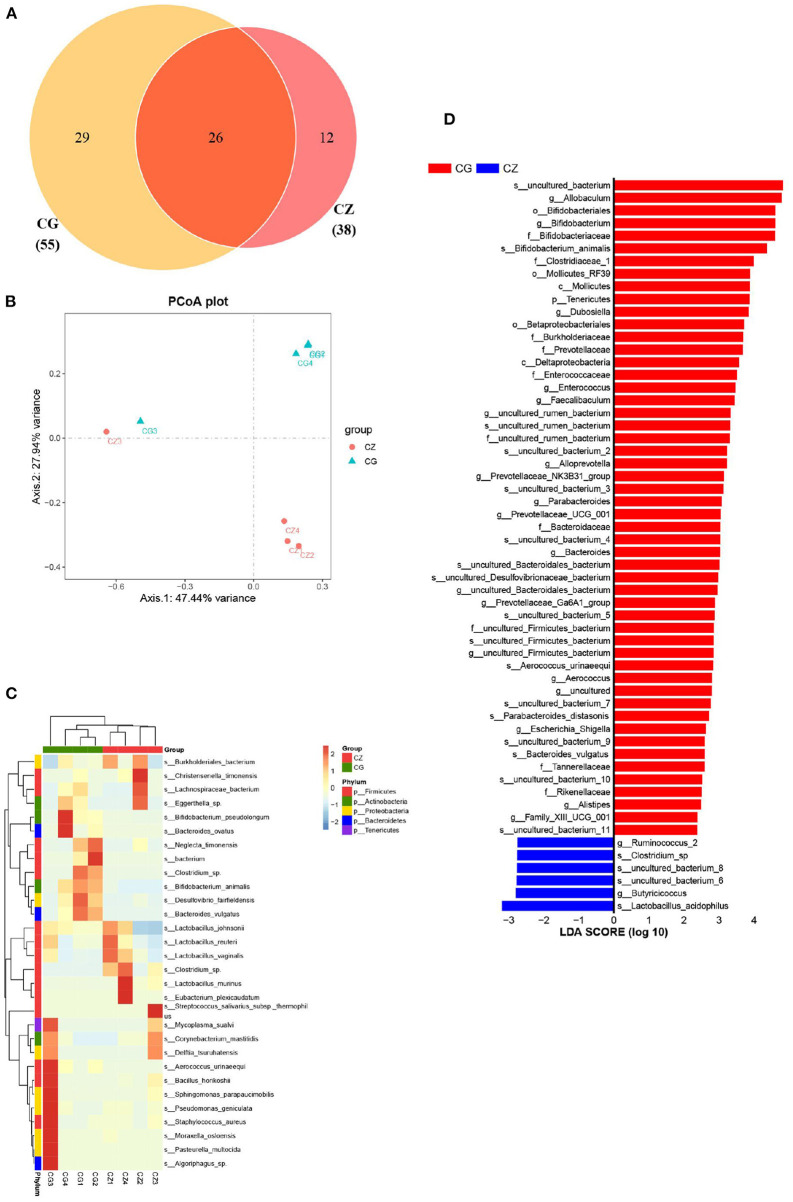
Figure 2.
The diversity, composition and key bacteria of intestinal microbiota with hypertension of liver-Yang hyperactivity syndrome induced by a high salt diet at species level. (A) Venn diagram of OTU distribution at species level. (B) Cluser analysis of PCoA based on the OTUs of taxonomic bacterial species. (C) Heatmap clustering of community species abundance at species level, and the closer the color is to red, the higher the abundance. (D) Cladogram generated from the LEfSe analysis indicating the phylogenetic distribution from family to species of the microbiota (LDA score ≥ 2, P < 0.05). CZ, normal group, CG, hypertensive group.

