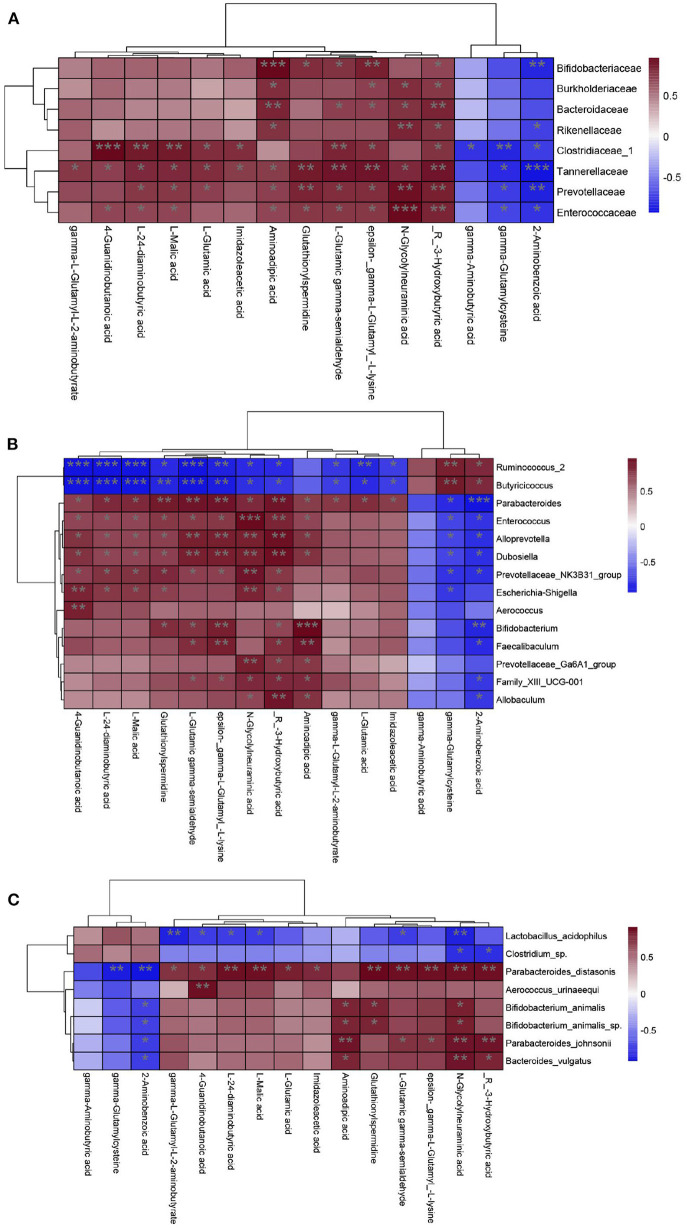
Figure 6.
Correlation analysis of gut microbiota and metabolites from family to species level. (A) Family level. (B) Genus level. (C) Species level. Heat maps indicated positive (red) and negative (blue) correlations between the dominant species and 15 differential metabolites we focus. The legend shows correlation values from −1 to 1 and assigns the appropriate color to them (Red for positive correlations and blue for negative correlations). (A–C) *P < 0.05, **P < 0.01.

