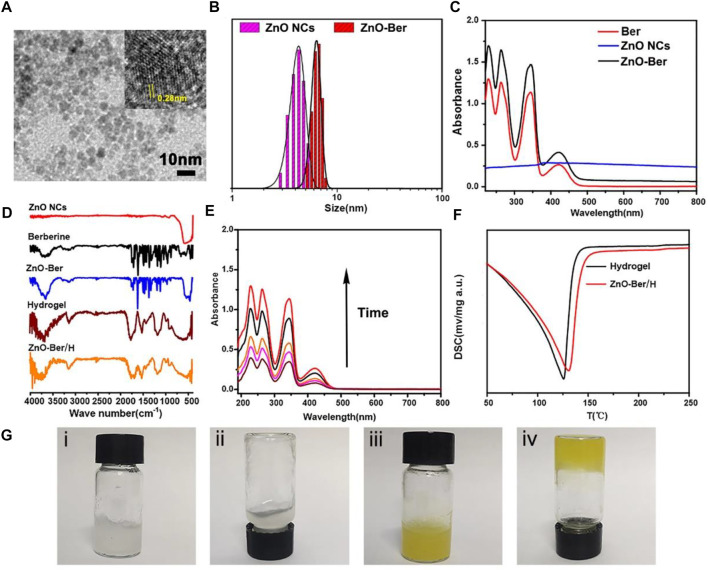
FIGURE 1.
(A) TEM images of ZnO NCs, the insert was the labeled distance of 2.8 Å corresponded to the {10 0} lattice spacing. (B) The size and size distributions of ZnO NCs and ZnO-Ber were determined by DLS. (C–D) UV–vis data and FTIR spectra data of ZnO NCs, Berberine and ZnO-Ber/H. (E) Released of berberine from ZnO-Ber in different time. (F) DSC results of the Hydrogel and ZnO-Ber/H. (G) Digital photos of Hydrogel and ZnO-Ber/H. Scale bar, 10 nm.

