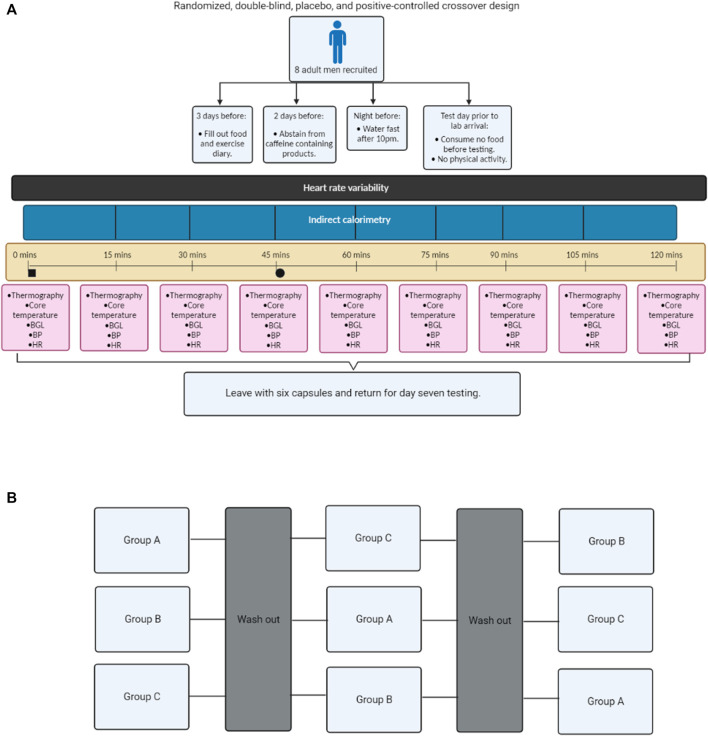
FIGURE 1.
Flow chart schematic of the study design. Experimental process (A); Cross over design (B). Blood glucose levels (BGL), blood pressure (BP), and heart rate (HR). Black square = time of carbohydrate load, Black circle = time of intervention, Group A = Caffeine powder supplementation, Group B = C. annuum fruit powder supplementation, and Group C = placebo supplementation. Washout period was a minimum of 7 days.

