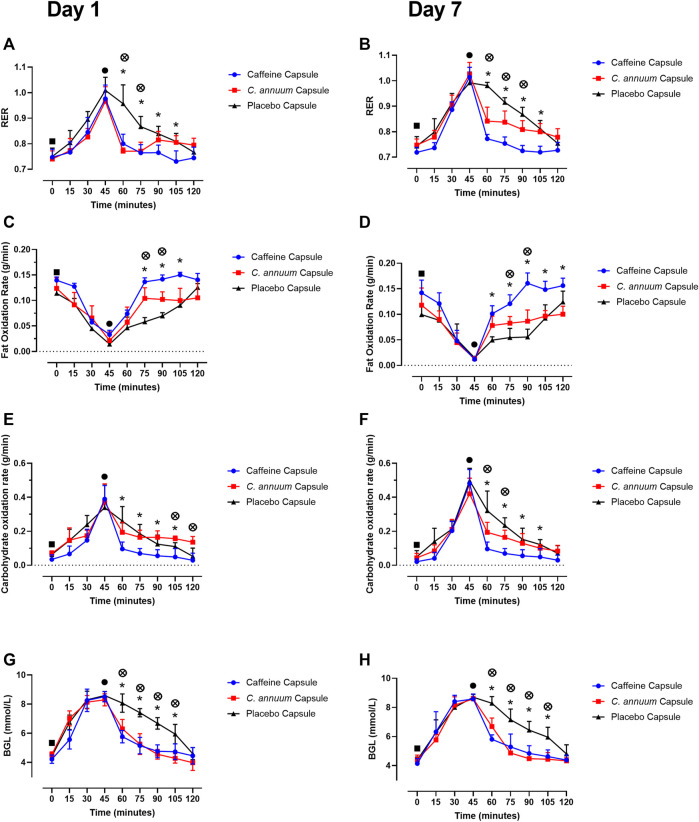
FIGURE 2.
Effects of interventions on metabolic measures. Respiratory exchange ratio (RER) (A) day 1 and (B) day 7. Fat oxidation rate (C) day 1 and (D) day 7, and carbohydrate oxidation rate (E) day 1, (F) day 7. Blood glucose levels (G) day 1, and (H) day 7. Filled black square, time of carbohydrate load; filled black circle, time of intervention; blue circle, caffeine capsule; red square, C. annuum fruit powder capsule; black triangle, placebo capsule. Data is expressed as mean ± SD, n = 8 per intervention, *represents caffeine interaction effect, ⊗ represents C. annuum fruit powder interaction effects (*, ⊗ p < 0.05). Data values were analysed using repeated measures 3-way analysis of variance (ANOVA; day × treatment × time). Each ANOVA assessed differences between treatments (caffeine, C. annuum fruit powder, control), day (1 and 7), and time points. If a significant interaction or main effect was found, post hoc analysis was conducted via a t-test between trials. For multiple comparisons a Bonferroni correction was applied.

