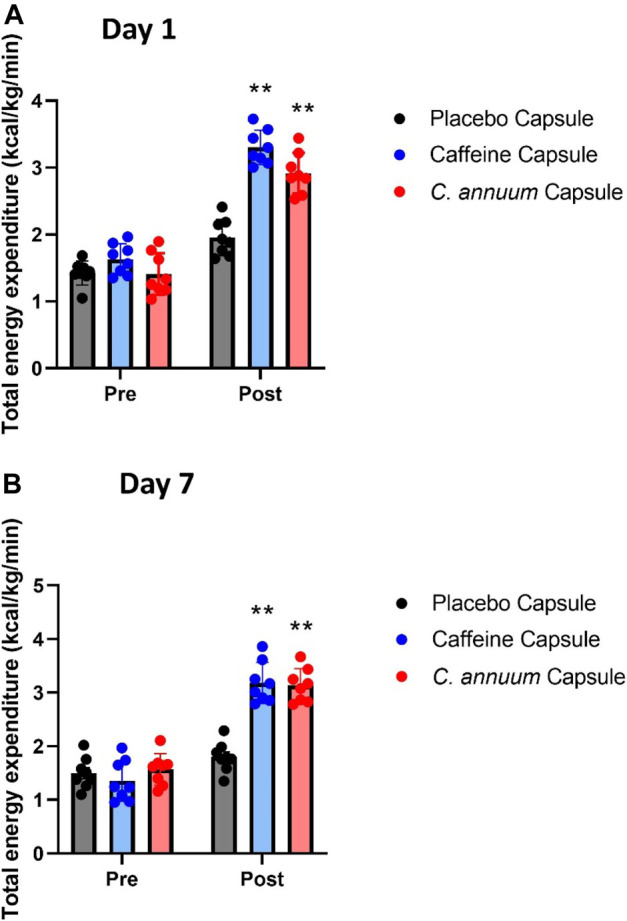
FIGURE 3.

Changes in whole-body energy expenditure in participants between pre- and post-administration of interventions in a 120 min period. (A) day 1 and (B) day 7. Grey bar, placebo capsule; blue bar, caffeine capsule; red bar, C. annuum fruit powder capsule. Data is expressed as mean ± SD, n = 8 per intervention, *represents interaction effect (**p < .001). Data values were analysed using repeated measures 2-way analysis of variance (ANOVA; pre × post). Each ANOVA assessed differences between treatments (caffeine, C. annuum, and placebo) and time points (pre vs. post intervention).
