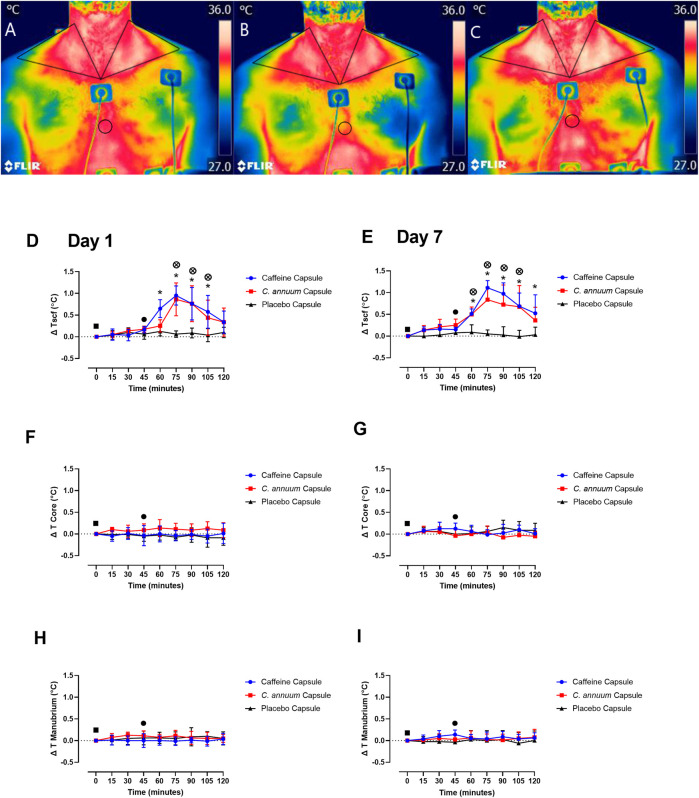
FIGURE 4.
Representative example of thermal images of the skin overlying the region of interest (ROI) located at the supraclavicular fossa (SCF) and sternal (circular ROI) area in participants. (A) at baseline measurement, (B) 15 min post carbohydrate load and (C) at 90 min post intervention with caffeine treatment. Changes in temperature (ΔT) of SCF, core and manubrium in participants following a carbohydrate load (time = 0), and administration of a caffeine capsule, C. annuum fruit powder capsule, or placebo capsule (time = 45) to 120 min. SCF temperature (D) day 1 and (E) day 7. Core temperature (F) day 1 and (G) day 7, and manubrium temperature (H) day 1, (I) day 7. Filled black square, time of carbohydrate load; filled black circle, time of intervention; blue circle, caffeine capsule; red square, C. annuum fruit powder capsule; black triangle, placebo capsule. Error bars represent S.D., n = 8 per intervention, *represents caffeine interaction effect, ⊗ represents C. annuum fruit powder interaction effects (*, ⊗ p < 0.05). The data values were analysed using repeated measures 3-way analysis of variance (ANOVA; day × treatment × time). Each ANOVA assessed differences between treatments (caffeine, C. annuum fruit powder, control), day (1 and 7), and time points. If a significant interaction or main effect was found, post hoc analysis was conducted via a t-test between trials. For multiple comparisons a Bonferroni correction was applied. Values were considered to indicate statistical significance if p < 0.05.

