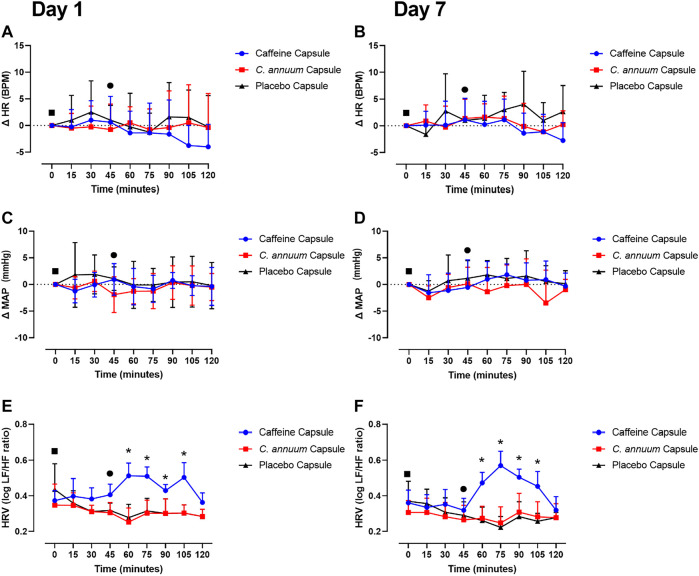
FIGURE 5.
Effects of interventions on cardiovascular measures of participants. The cardiovascular measures were made following a carbohydrate load (time = 0), and administration of a caffeine capsule, C. annuum fruit powder capsule, or placebo capsule (time = 45) to 120 min. Changes (Δ) in heart rate (A) day 1 and (B) day 7. Δ in mean arterial pressure (MAP) (C) day 1 and (D) day 7, and heart rate variability (HRV) (E) day 1, (F) day 7. Filled black square = time of carbohydrate load, filled black circle = time of intervention, blue circle = caffeine capsule, red square = capsicum capsule, and black triangle = placebo capsule. Error bars represent S.D., n = 8 per intervention, *represents caffeine interaction effect, ⊗ represents capsicum interaction effects (*, ⊗ p < 0.05). The data values were analysed using repeated measures 3-way analysis of variance (ANOVA; day × treatment × time). Each ANOVA assessed differences between treatments (caffeine, C. annuum, control), day (1, 7), and time points. If a significant interaction or main effect was found, post hoc analysis was conducted using Bonferroni’s test. Values were considered to indicate statistical significance if p < 0.05.

