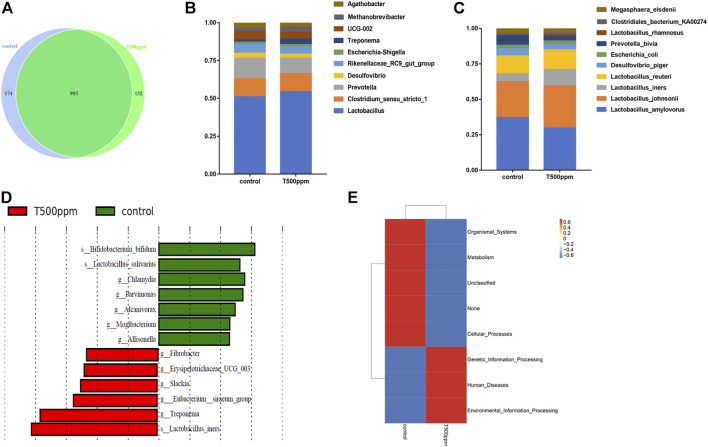
FIGURE 4.
(A) Venn diagram of the OTU analysis of intestinal microorganisms. (B) TOP 10 of the genus relative abundance histogram at the genus level. (C) TOP 10 of the species relative abundance histogram at the species level. (D) LDA effect size analysis. (E) PICRUSt functional annotation clustering heat map.

