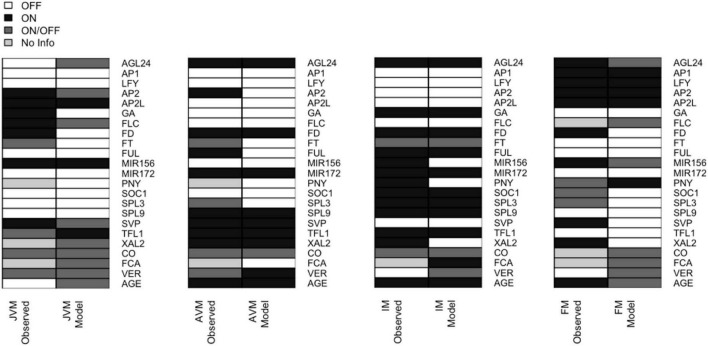
FIGURE 4.
The expression patterns in the attractors recovered by the FT-GRN model are like the ones observed during development. The 32 attractors recovered by the model can be classified into four phenotypes (JVM, AVM, IM, and FM). The gene expression patterns observed in planta (left) are compared to the model predicted gene expression patterns (right). The node state can be expressed/active (ON, black) or not expressed/inactive (OFF, white); or can be in either state ON or OFF (dark gray); the unknown expression patterns were label as “No Info” (pale gray). For individual attractors’ information, see Supplementary Figure 3, and for references of gene expression patterns in planta consult Supplementary Table 5.

