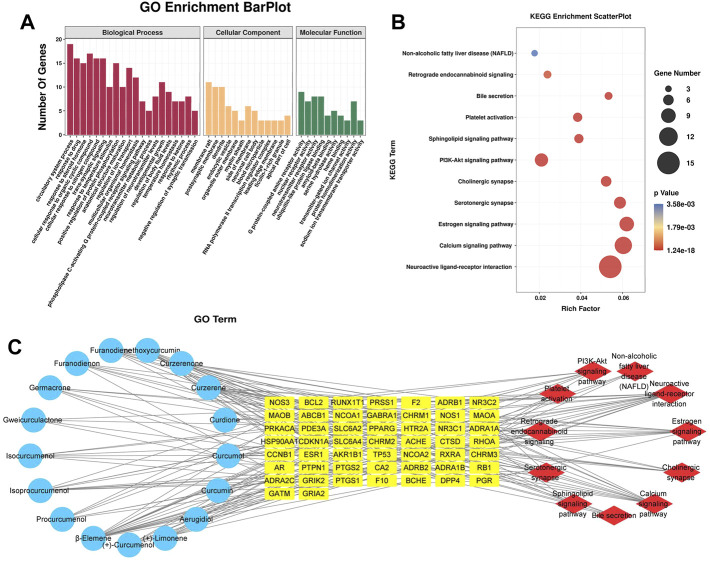
FIGURE 2.
Analysis results of network pharmacology. (A) GO enrichment analysis. The horizontal axis represents the GO term, and the vertical axis represents the number of genes; (B) KEGG pathway enrichment analysis. The horizontal axis represents the rich factor, and the vertical axis represents the pathways. The bubble size represents the number of targets in the pathway. The bubble color indicates the magnitude of the p-value. The redder the color, the lower the p-value; (C) The active ingredient-target-pathway network. Blue represents the active components, yellow represents targets, and red represents the pathways.

