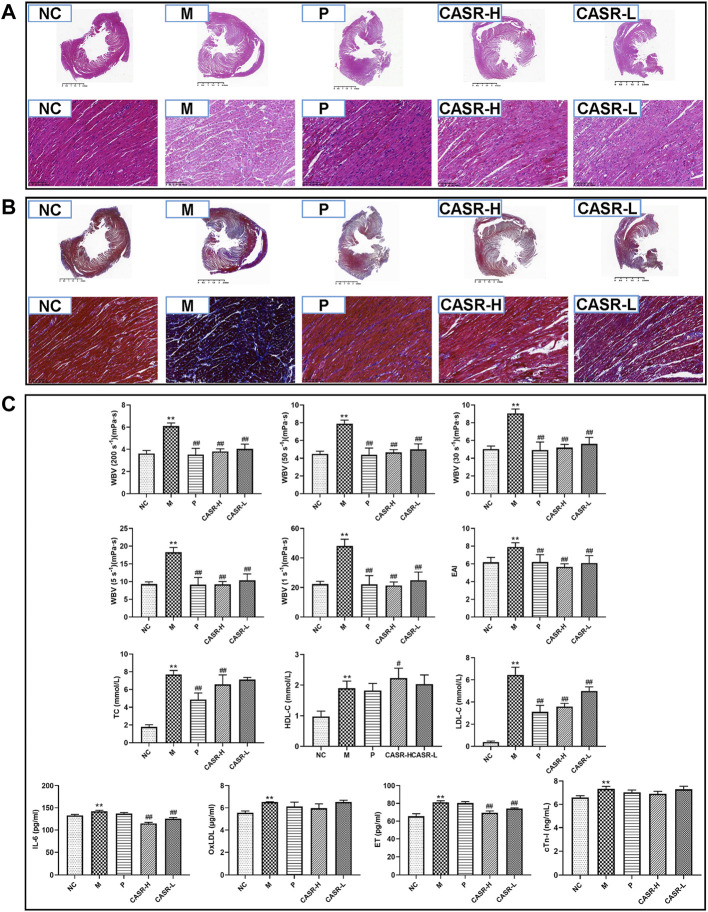
FIGURE 3.
Experimental validation results in vivo. (A) Heart histopathological changes of H&E staining (magnification = 20× and 500×). Nucleus was stained purple-blue and cytoplasm was stained red; (B) Heart histopathological changes of Masson staining (magnification = 20× and 500×). Collagen fibers appear in blue and muscle fiber appear in red; (C) Hemorheological parameters and serum biochemical indicators. All values were presented as mean ± SD (n = 6–8). All p-values were calculated by T test. * p < 0.05, ** p < 0.01 compared with NC group, # p < 0.05, ## p < 0.01 compared with M group. NC: normal control group; M: model group; P: positive drug (atorvastatin calcium tablets) control group; CASR-H: Curcuma aromatica Salisb. rhizome high-dose treatment group; CASR-L: Curcuma aromatica Salisb. rhizome low-dose treatment group.

