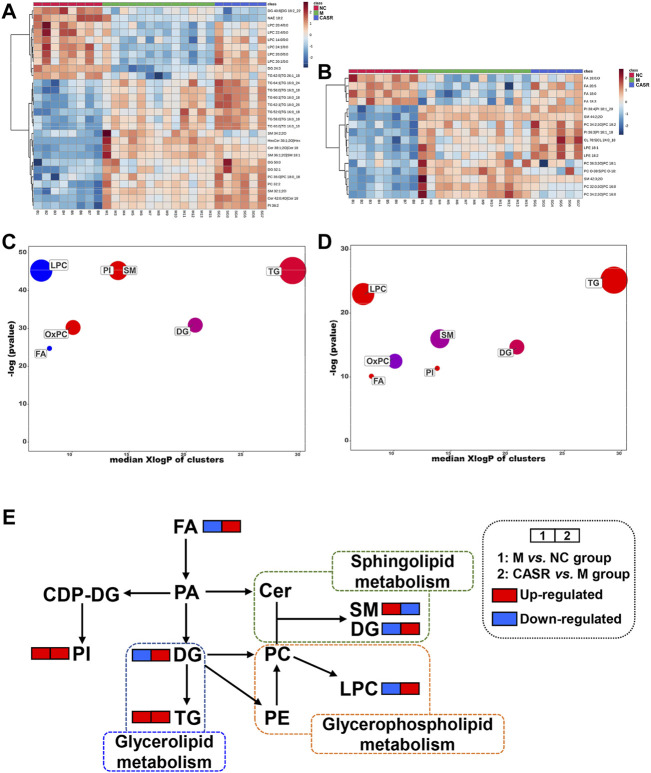
FIGURE 4.
Summary of differential lipids. (A) Heatmap of differential lipids in positive mode; (B) Heatmap of differential lipids in negative mode. Each column represents a sample and each row represents a differential lipid. Red changes to blue when the intensity becomes smaller, and vice versa. The darker the red, the larger the value; (C) Enrichment statistics plot of significantly regulated lipids (M vs. NC group); (D) Enrichment statistics plot of significantly regulated lipids (CASR vs. M group). Each bubble represented a significantly changed lipid group (p < 0.05), and the bubble size reflected the total number of lipids contained in each lipid group. Red represents increased lipids and blue represents decreased lipids. The purple bubbles have both increased and decreased lipids; (E) The metabolic network profile. The names of the possible metabolic pathways are denoted in the green, blue and orange dotted box. NC: normal control group; M: model group; P: positive drug (atorvastatin calcium tablets) control group; CASR: Curcuma aromatica Salisb. rhizome treatment group.

