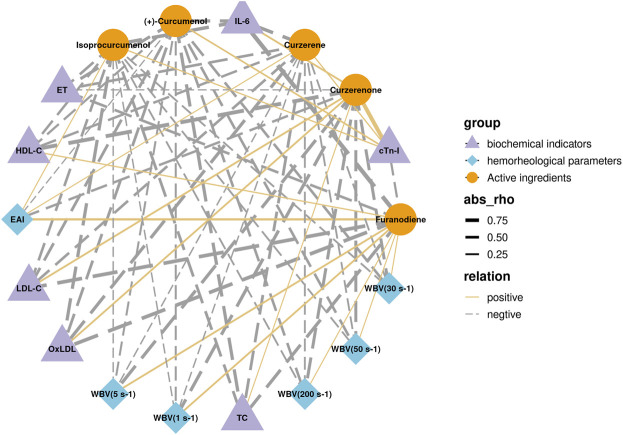
FIGURE 5.
Correlation analysis results between core active ingredients and pharmacodynamic indicators. Purple triangles represent biochemical factors; blue diamonds represent hemorheological parameters; yellow circles represent active compounds; the thickness of the line represents the magnitude of the correlation; solid and dashed line represents positive and negative correlations, respectively.

