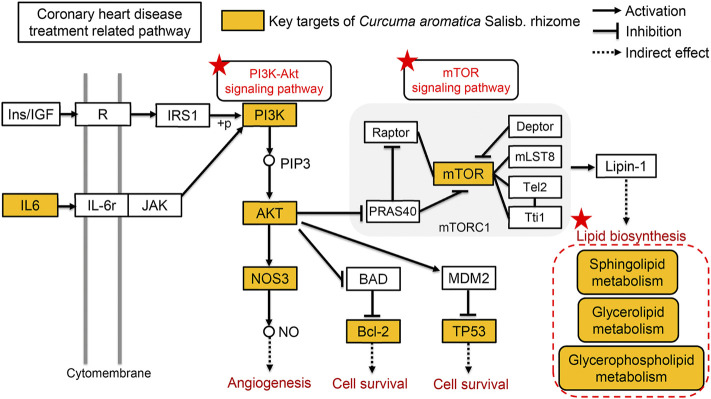
FIGURE 6.
Comprehensive analysis of the therapeutic mechanism of CASR against CHD. The yellow squares represent the key targets of CASR in the treatment of CHD. Pentagrams represent key pathways involved. The arrows represent activation effects, the T-shaped arrows represent inhibition effects, and the segments represent indirect effects.

