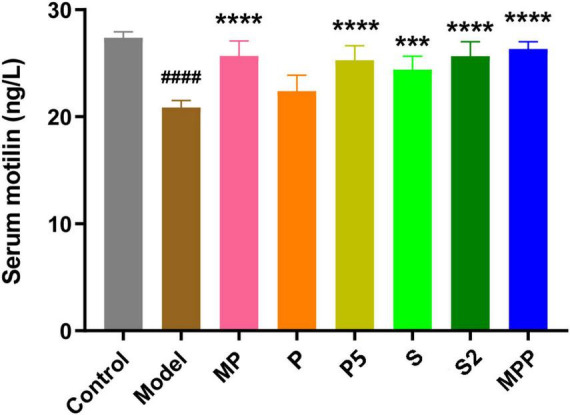
FIGURE 2.

The differences in serum motilin level among groups. Values are expressed as mean ± SEM (n = 8). Results were compared by one-way ANOVA and Dunnett’s multiple comparison test: ***p < 0.001, ****p < 0.0001 compared with the model group; ####p < 0.0001 compared with the control group.
