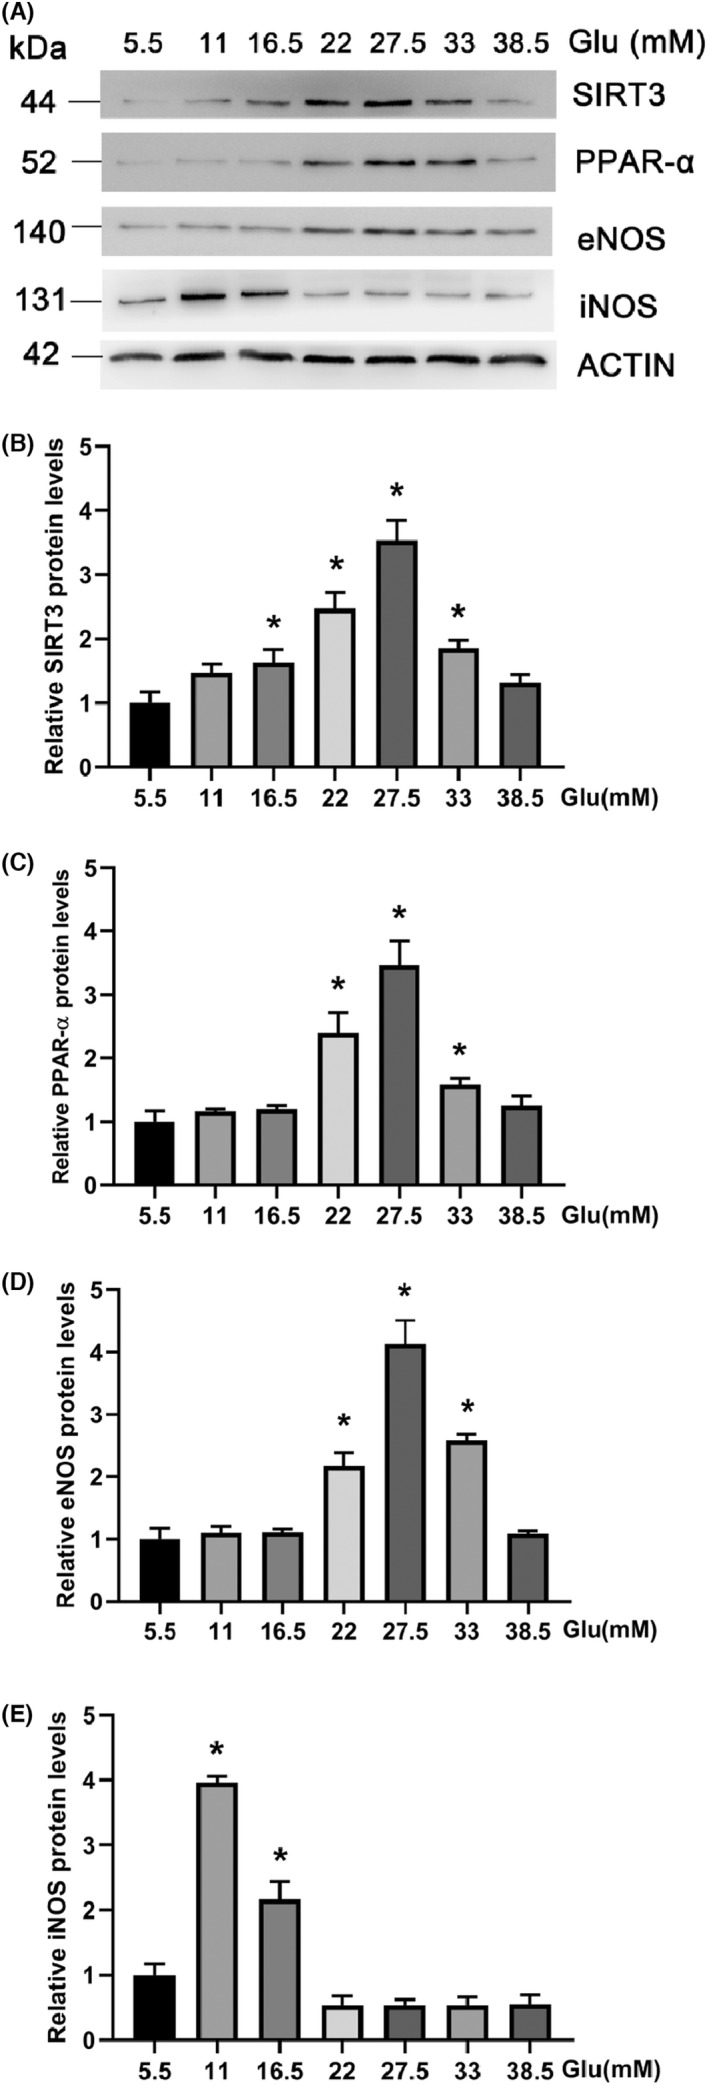
FIGURE 3.

(A) Western blot analysis of SIRT3, PPAR‐α, eNOS and iNOS expression in HAECs with indicated concentrations of glucose. (B) Quantification of the SIRT3 level with Actin as a reference. (C) Quantification of the PPAR‐α level with Actin as a reference. (D) Quantification of the eNOS level with Actin as a reference. (E) Quantification of the iNOS level with Actin as a reference. *p < 0.05 vs. 5.5 mM Glucose
