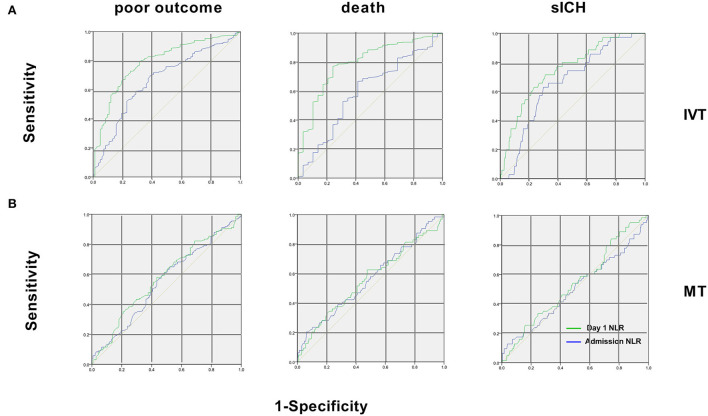
Figure 3.
Receiver operating characteristic curves of NLR for the 3 endpoints in patients with IVT and MT. (A) In patients with IVT, for poor outcome, areas under the curve were 0.66 for admission NLR and 0.78 for day 1 NLR. For 90-day death, areas were 0.60 for admission NLR and 0.81 for day 1 NLR. For sICH, areas were 0.63 for admission NLR and 0.74 for day 1 NLR; (B) In patients with MT, areas under the curve were 0.55 (95% CI 0.48–0.6) for admission NLR and 0.57 (95% CI 0.48–0.66) for day 1 NLR for poor outcome. For 90-day death, areas were 0.57 (95% CI 0.44–0.63) for admission NLR and 0.58 (95% CI 0.45–0.67) of day 1 NLR. For sICH, areas were 0.51 (95% CI 0.42–0.65) for admission NLR and 0.56 (95% CI 0.43–0.6) for day 1 NLR. IVT, intravenous thrombolysis; MT, mechanical thrombectomy; sICH, symptomatic intracerebral hemorrhage.

