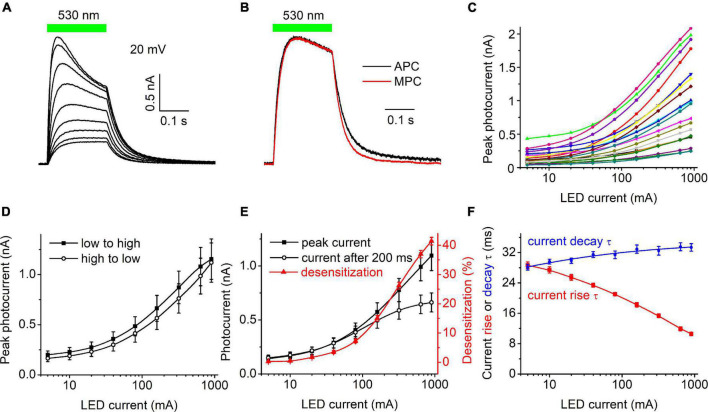
FIGURE 1.
(A) A series of photocurrent traces generated by HcKCR1 at 20 mV in response to 200-ms light pulses of incremental intensity. The bar on top shows the duration of illumination. (B) Comparison of the normalized photocurrent traces recorded by automated patch clamp (APC, black) at 40 mA forward LED current and by manual patch clamp at 0.2 mW mm–2 (MPC, red). (C) The dependence of the peak current amplitude on the light intensity (LED current) for 20 individual cells. (D) The mean curves for the responses measured upon variation of the LED current from low to high and from high to low values. (E) The mean curves for the peak current and desensitized current at the end of the 200-ms light pulse (black symbols and lines, left axis). The red symbols and line (right axis) show the degree of desensitization calculated as the difference between the peak current and the current at the end of 200-ms illumination divided by the peak current and multiplied by 100%. The data points in (C,E) are connected with spline lines. (F) The dependence of photocurrent rise τ (red) and the main (fast) decay τ (blue) on the light intensity. The data points for the rise τ are connected with a B-spline line; the data for the decay τ are approximated with a logistic function.

