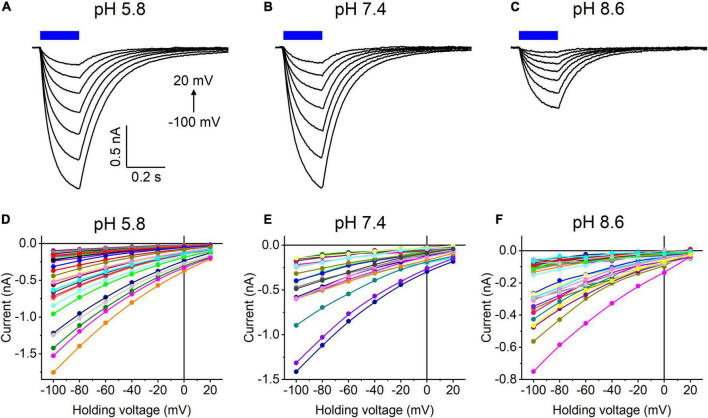
FIGURE 4.
(A–C) Photocurrent traces recorded from HcCCR at the indicated external pH in response to a 200-ms light pulse (470 nm, 475 mA), the duration of which is shown as a colored bar on top. The holding voltage was varied from –100 to 20 mV in 20-mV steps. (D–F) Current-voltage relationships of HcCCR measured in individual cells. The current amplitude was measured at the end of a 200-ms light pulse.

