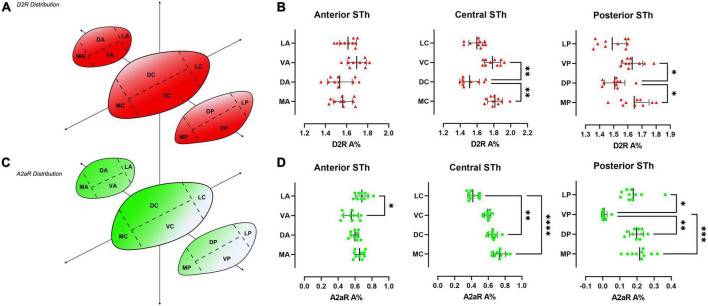
FIGURE 4.
Heatmap of the distribution of D2R (A) and A2AR (C) throughout the rostro-caudal extent of the STh, indicating a decreasing ventral-to-dorsal gradient for D2R, and an opposite decreasing dorsomedial-to-ventral gradient for A2AR. (B,D) Non-parametric ANOVA (Friedman’s test) of the different levels of sectioning throughout the STh reveals topographical differences within specific STh subregions.

