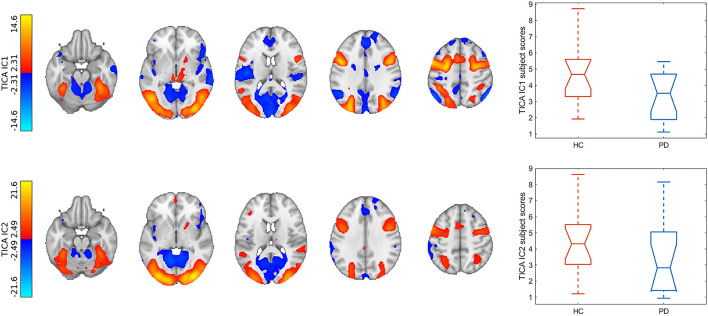
Figure 2.
Results of the multivariate analysis. Spatial maps of task-relevant components were upsampled to 1 mm resolution and overlaid on the MNI152 1 mm template. Color bars denote Z-statistics. Box plots show group differences in subject modes of corresponding components. TICA, tensorial independent component analysis; IC, independent component; HC, healthy control; PD, Parkinson's disease.

