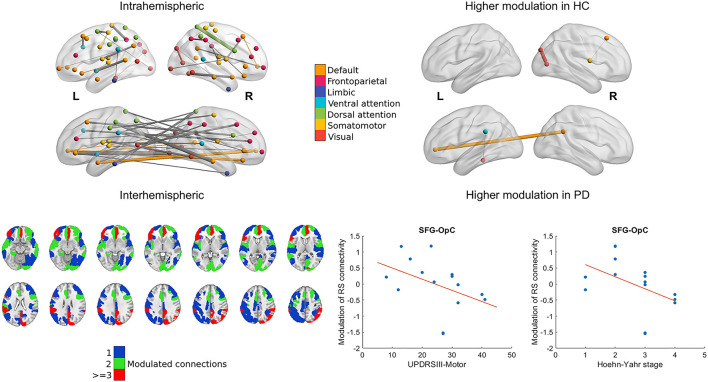
Figure 3.
Modulation of cortical resting-state functional connectivity during the task. The 3D representations show relevant intra- and interhemispheric connections that were consistently modulated during the task in the healthy group (marked by a change with an effect size of at least t = 3.1 in connectivity; left) or were modulated differently in the healthy and PD cohort (right). Nodes and within-network edges are color-coded according to their overlap with the 7-network parcellation in (27); between-network edges are shown in gray. Axial slices show parcels from the Schaefer atlas with at least 1 connection modulated consistently group-wise during the task. Parcel ROIs were overlaid on the MNI152 1 mm brain template and are shown in neurological orientation. Scatter plots show the statistically significant association between clinical characteristics and modulation of the superior frontal gyrus (SFG)–opercular cortex (OpC) connection in the PD cohort with a least-squares line superimposed.

