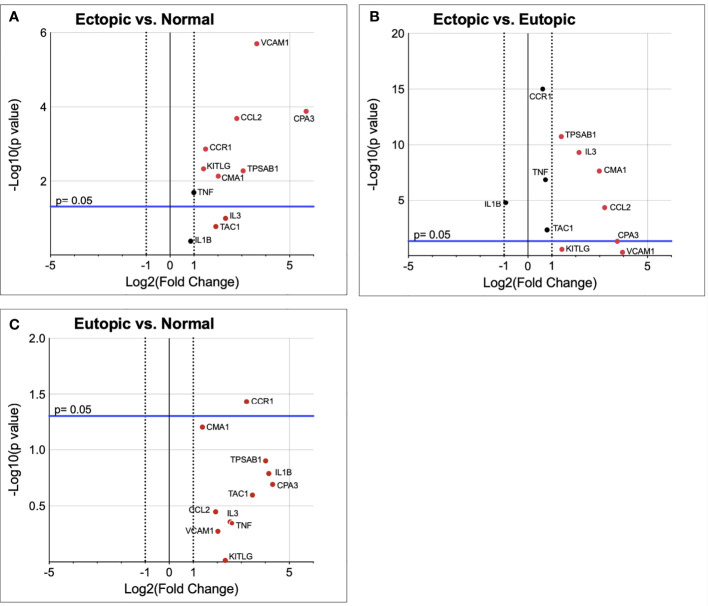
Figure 1.
Mast cell relevant genes are upregulated in endometriotic lesion tissue. Gene transcript fold change in ectopic endometriotic lesion (n=9) vs normal healthy endometrium (n=10) (A), eutopic endometrium (n=8) of endometriosis patients vs normal healthy endometrium (B), and ectopic endometriotic lesion vs eutopic endometrium of endometriosis patients (C). Vertical dotted lines represent a fold change of ±2, where data points outside this range have shown a fold change of more than 2.0. The blue horizontal line denotes p= 0.05 in -Log10, where data points above the blue line are significantly upregulated in the tested group.

