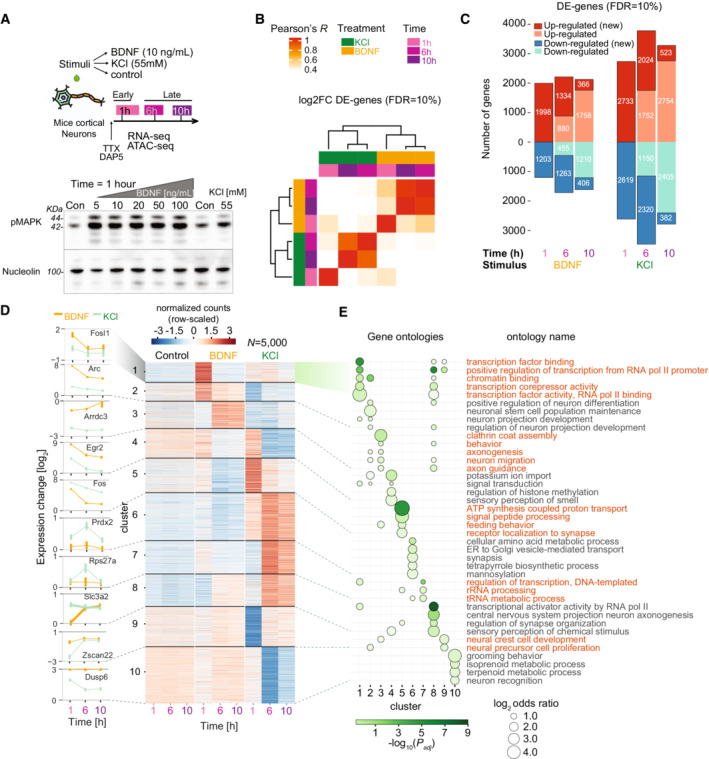
Figure 1. Transcriptional dynamics in mouse cortical neurons (CNs) upon neuronal stimulation with brain‐derived neurotrophic factor (BDNF) and potassium chloride (KCl) defines early and late gene programs.

-
A(top) Experimental design. Cultured CNs are stimulated with BDNF, KCl or no treatment (Control) and stimulated neurons are prepared for RNA‐seq and ATAC‐seq at three specific timepoints: early (1 h) and late (6 and 10 h); (bottom) Blot for pMAPK in neurons treated with KCl 55 mM and several concentrations of BDNF (Con = no stimulation). 44 and 42 kDa bands indicated with lines. Nucleolin is shown as internal control.
-
BHierarchical clustering for all differentially expressed‐genes (DE‐genes, adjusted P‐value < 0.1, using Benjamini–Hochberg's correction) using correlation of log2‐fold changes when compared to unstimulated control samples at each timepoint.
-
CNumber of DE‐genes at each timepoint and treatment combination (above and below zero indicates up‐ and down‐regulated genes, respectively). Darker shades indicate genes newly up‐/down‐regulated at a given timepoint (new).
-
DPartitioning around medoids clustering of expression dynamics using genewise‐scaled Z‐scores of top 5,000 DE‐genes from (c) with lowest adjusted P‐value (k = 10 clusters). Numbers indicate clusters. Left line plots indicate expression levels for signature genes selected for each cluster. 4,907 DE‐genes are also selected with FDR = 1% and more than 100 counts across samples.
-
EGene ontology (GO) enrichment analysis for clusters shown in (d). Each ribbon shows clusters with their respective significant gene groups using topGO (Alexa et al, 2006). Up to five significant terms per cluster are shown (P‐values adjusted with BH). Circle sizes indicate enrichment of ontology genes in each cluster versus all other clusters. Names on the right y‐axis indicate ontology common names.
