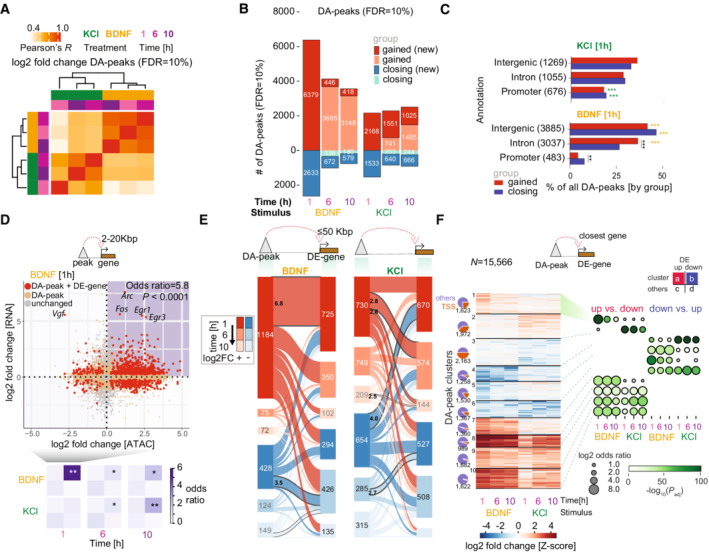
Figure 2. Chromatin accessibility changes upon neuronal activation with brain‐derived neurotrophic factor (BDNF) and potassium chloride (KCl) reveals early BDNF regulatory control of gene expression.

-
AHierarchical clustering for all differentially accessible peaks (DA‐peaks, adjusted P < 0.1, using Benjamini–Hochberg's correction) using correlation of log2‐fold changes when compared versus matched control samples.
-
BNumber of DA‐peaks at each timepoint and treatment combination (above and below zero indicates gained and closing DA‐peaks, respectively). Darker shades indicate peaks newly gained/closing at a given timepoint (new).
-
CPercentage of gained and closing DA‐peaks grouped by top genomic annotations at the 1 h timepoint (by percentage). Numbers in parenthesis next to each annotation label indicate the absolute number of peaks associated with the annotation. Gray asterisks indicate within‐stimulation Fisher's exact test comparisons. Green/yellow asterisks indicate between‐stimulation comparisons, wherever one peak set is significantly enriched for one annotation (**P < 0.01; ***P < 0.001).
-
D(top) Association between DREs and gene expression at the BDNF 1 h timepoint. Each point indicates the log2‐fold change of an ATAC‐seq peak (x‐axis) and the gene expression of the closest gene (y‐axis) with distance between 2–20 Kbp. Colors indicate whether none (gray), only the peak (orange), or both peak and gene (red) show significant changes versus control neurons. (bottom) Enrichment for paired DA‐peak and DE‐gene in the four quadrants is summarized for BDNF and KCl. Asterisks indicate P‐values as corrected by a Benjamini–Hochberg procedure (*P < 0.05; **P < 0.01).
-
ENumber of associations between DA‐peaks and DE‐genes for KCl (left) and BDNF (right). Sankey plot shows closest DE‐genes with distances < 50 kbp to DA‐peaks. Numbers in connecting areas between peaks and genes indicate association Z‐scores between DA‐peaks and DE‐genes (shown only if one is significant using Fisher's exact test (adjusted P < 0.1) and Z‐scores greater than 2.5), using a permutation approach for DA‐peaks and their connected DE‐genes while maintaining timewise changes (see Materials and Methods).
-
F(left) Partitioning around medoids clustering of accessibility dynamics using scaled Z‐scores for log2 fold changes of all DA‐peaks in (b) (k = 10 clusters). Venn diagrams indicate the proportion of peaks in each cluster associated with TSS or any other regulatory region (right) Enrichment of up‐regulated (DE‐up) versus down‐regulated (DE‐down) DE‐genes (up vs. down), and enrichment of DE‐down versus DE‐up genes (down vs. up) in closest genes within a cluster when compared with the same category in other clusters. Enrichments are calculated using Fisher's exact test, with adjusted P‐value correction via Benjamini–Hochberg.
