
Figure 5. Chromatin–transcription factor (TF) interactions during mouse neuronal activation and their association with promoter‐exon loops and splicing.
-
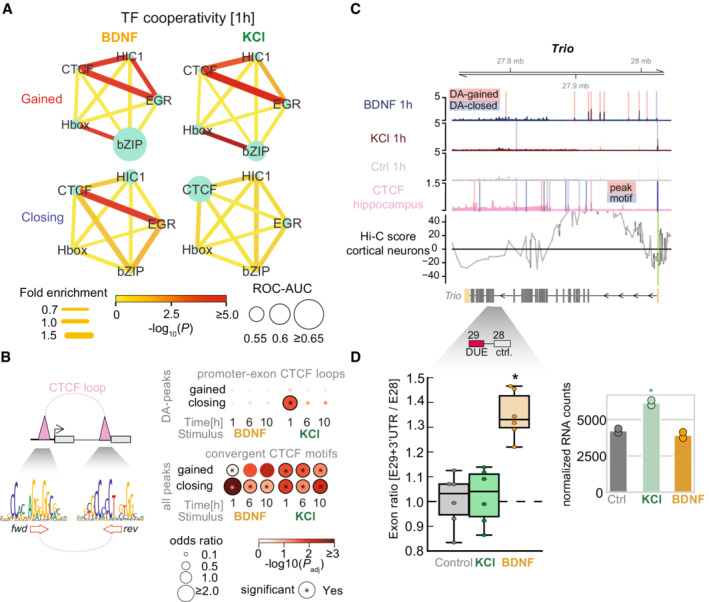
AEnrichment association networks between HIC1/bZIP/EGR/CTCF and Hbox based on results from (Fig 4A). Circle sizes indicate ROC‐AUC using motifs for each TF alone in those peaks. Edges weights and colors indicate fold enrichment for co‐occupied peaks versus single peaks, and significance of association. Calculations were done with SuperExactTest (Wang et al, 2015).
-
B(top‐left) Scheme depicting CTCF‐loop connecting promoters and exons. (bottom‐left) CTCF‐loops are enriched for convergent CTCF motifs. (top‐right) Enrichment of promoter‐exon CTCF loops in gained and closing DA‐peaks (loop annotations from Ruiz‐Velasco et al (2017)). (bottom‐right) Enrichment of convergent CTCF motifs with a distance of less than 50 Kbp in gained DA‐peaks and closing DA‐peaks over unchanged peaks as background.
-
CGenome tracks harboring the Trio gene. ATAC‐seq tracks indicate DA‐peaks (red highlight = gained DA‐peak; blue highlight = closing DA‐peak); CTCF tracks indicate the presence of motifs (pink highlight = ChIP‐seq peak; blue highlight = motif based on CTCF Position Weight Matrix). Below gene models, reference DUE exon position is highlighted (red); control exon (highlighted in gray) is used for comparison.
-
D(left) Exon ratio between E29 + 3′UTR and E28 fold changes 1 h after treatment with BDNF (orange), KCl (green), and control (gray). Central band indicates median. Boxes indicate interquartile range (IQR, or Q3‐Q1). Central band indicates median. High and low whiskers indicate first datum higher than Q3 + 1.5*IQR, or lower than Q1–1.5*IQR, respectively. Asterisk indicates significant changes versus control (t‐test, two‐sided; *P < 0.1). (N = 2, independent biological replicates). (right) Normalized gene counts for gene expression values versus control (*adjusted P‐value < 0.1 versus control).