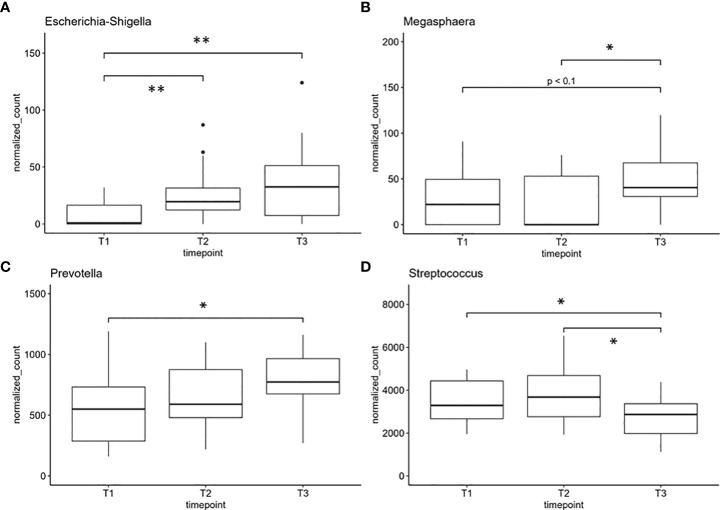
Figure 5.
Genera with significant differences in normalized counts between sample groups: (A) Escherichia/Shigella, (B) Megasphaera, (C) Prevotella, and (D) Streptococcus, one of the most abundant genera. *indicates pvalue < 0.05. **indicates pvalue < 0.01. T1: before/at start of chemotherapy, T2: 12 weeks after the onset of chemotherapy, T3: 52 weeks after the onset of chemotherapy.

