FIGURE 4.
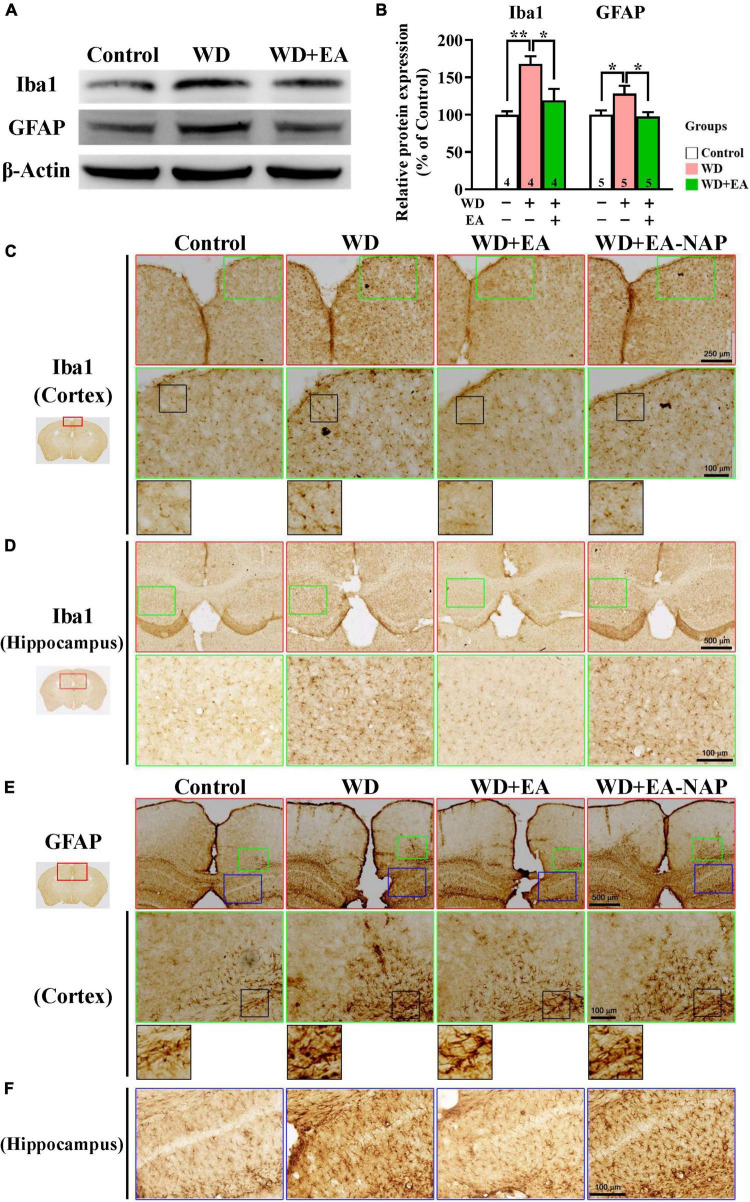
EA treatment attenuated WD-TBI-induced activation of microglia and astrocytes. (A) Representative Western blot results show levels of Iba1 and glial fibrillary acidic protein (GFAP) at 48 h in the mouse cortex from the Control, WD, and WD+EA groups. β-Actin was used as the loading control. (B) Quantitative analysis of Iba1 and GFAP protein expression levels in (A). (C) Representative images of IHC staining show anti-Iba1 (C,D) and anti-GFAP (E,F) antibody immunoreactivity in cortical and hippocampal areas of the Control, WD, WD+EA, and WD+EA-NAP groups. High magnification images marked by the small green or blue boxes from the top panels (red box) are shown below. The bottom panels in (C) and (E) show higher-magnification images of the cortex from the middle panels marked by the small black boxes. Scale bars of the red box panels in (C) are 250 μm; of the red box panels in (D) are 500 μm; of the green box panels in (C–E) are 100 μm; of the blue box panels in (F) are 100 μm. Data are the means ± S.E.M. of at least three independent experiments. *p < 0.05, **p < 0.01 (statistical testing was performed by one-way ANOVA/Newman-Keuls test). The number underneath each bar in (B) refers to the number of mice used in the study group. The original Western blot images are presented in Supplementary Figure 5. The F values of one-way ANOVA for (B) are presented in Supplementary Table 3.

