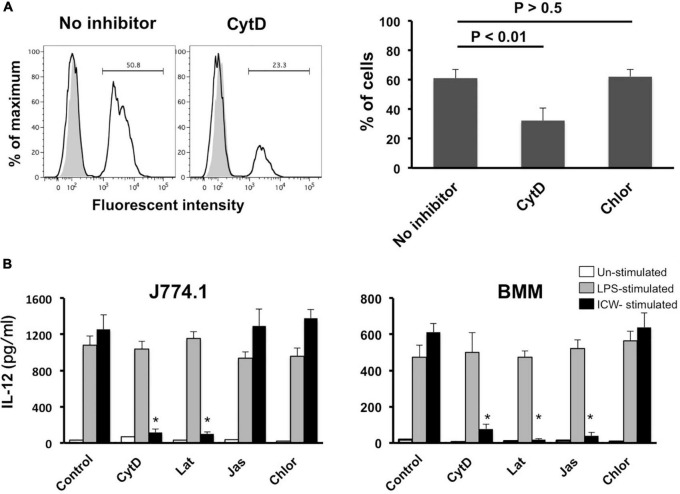
FIGURE 8.
Effect of actin polymerization inhibitors on uptake of ICWs and IL-12 secretion. (A) J774.1 cells were treated with cytochalasin D (CytD, 1 μM) or chlorpromazine (Chlor, 1 μg/ml) in complete RPMI1640 containing 0.1% DMSO for 30 min at 37°C. Fluorescein-labeled ICWs of L. plantarum TUA 5099L were added and the mixture was incubated for 30 min. Fluorescent signals in the cells were analyzed. Representative histograms (left) and percentages of positive cells among the treated cells (right) are shown. Gray and open histograms indicate untreated and fluorescein-labeled ICWs treated cells, respectively. (B) J774.1 cells and BMMs were treated with CytD (1 μM), latrunculin B (Lat, 1 μM), jasplakinolide (Jas, 0.1 μM), or Chlor (1 μg/ml) in complete RPMI1640 containing 0.1% DMSO for 30 min. Then the cells were stimulated with ICWs of L. plantarum TUA 5099L (10 μg/ml) or LPS (100 ng/ml). Culture supernatants were collected after 24 h and IL-12 in supernatants was determined. Open, gray and black columns indicate unstimulated, LPS-stimulated, and ICW-stimulated cells, respectively. Each bar is the mean ± SE for four independent experiments. *P < 0.01 vs. inhibitor-untreated cells.

