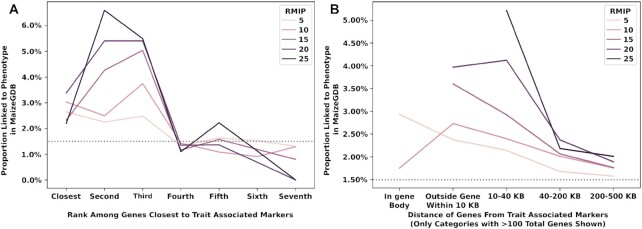
Figure 4:
Probability of genes at different distances from peak SNP from GWAS is linked to phenotypes. (A) Gene positions of unique trait associations. First 7 genes closest to the GWAS peaks were selected and shown on the x-axis. (B) Gene order of unique trait associations. The distance of the genes from the trait-associated markers is shown on the x-axis.

