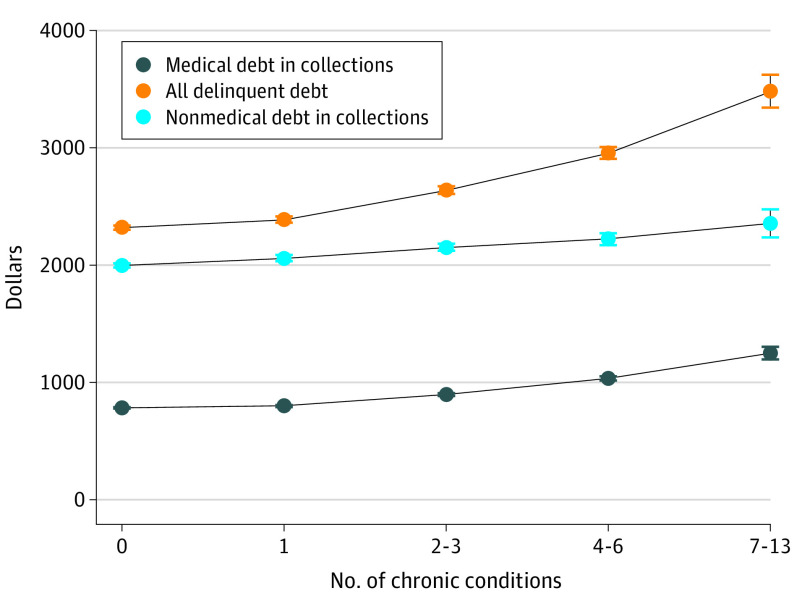
Figure 2. Average Debt Among Individuals With Nonzero Debt by the Number of Chronic Conditions.
Each line reports the estimated average debt (in dollars) for each debt outcome among individuals with any nonzero debt in that category by the number of chronic conditions. Results are from 2-part exponential hurdle models; additional covariates in all models include sex and age-band fixed effects. Standard errors are robust. All estimates for chronic condition categories greater than 0 are significantly different from 0 chronic conditions (all P ≤ .001). Error bars indicate the 95% CI for each estimate. Full regression estimates available in eTable 4 in the Supplement.

