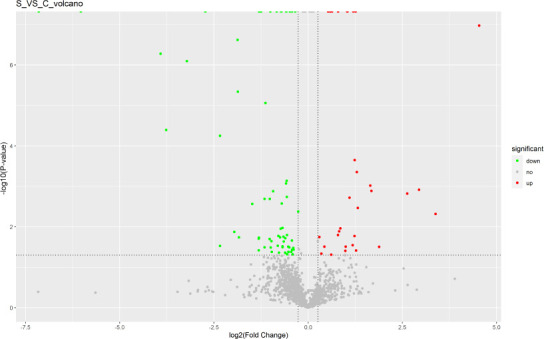
Figure 5.

Label-free quantification analysis of protein expression changes after platelet-rich plasma treatment for sciatic nerve injury.
In the volcano plot, the vertical coordinate shows the -log10 (P-value) value, and the horizontal coordinate shows the log2 (fold-change) value. The upregulated proteins reaching the threshold fold-change and P values are shown as red dots and the downregulated proteins are shown as green dots. The remaining proteins are shown as gray dots.
