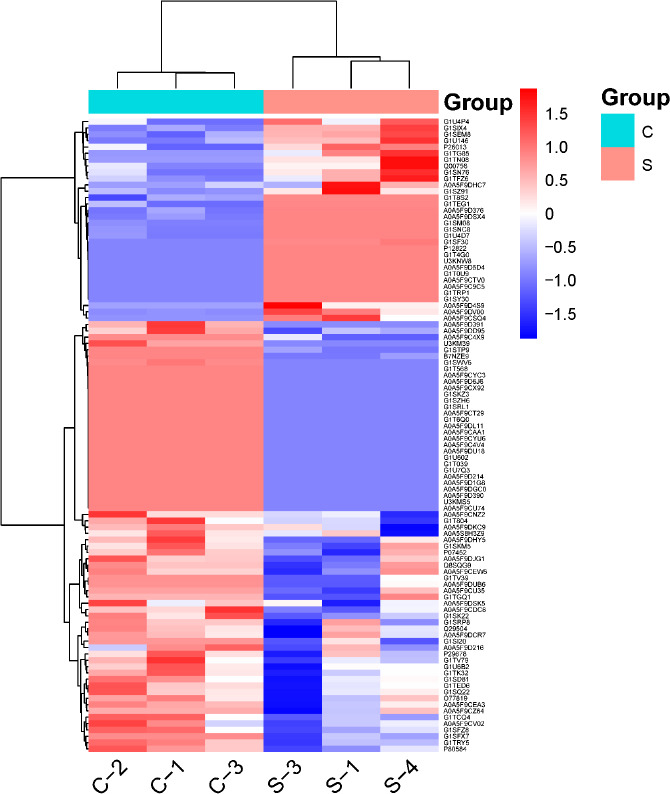
Figure 6.

Hierarchical clusters of protein expression changes after platelet-rich plasma treatment for sciatic nerve injury.
The horizontal coordinates represent the group names and the vertical coordinates represent the differentially expressed proteins. The red color indicates higher expression of the proteins, while the blue color represents lower expression. C: Model group; S: treatment group.
