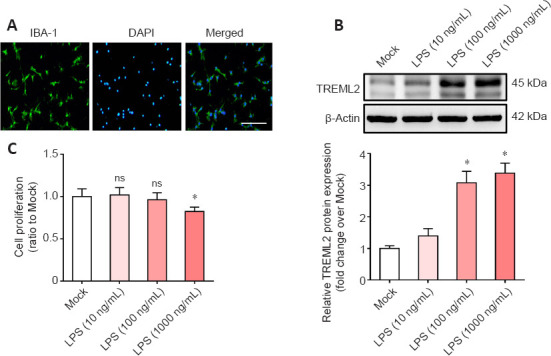
Figure 2.

Microglial TREML2 levels increase under inflammatory condition.
(A) Double immunofluorescence staining (DAPI [blue] and IBA-1 [green]) indicating that the primary microglia cells isolated from neonatal WT mice were over 95% pure. Scale bar: 50 μm. (B) TREML2 levels in primary microglia after stimulation with 10 ng/mL, 100 ng/mL, or 1000 ng/mL LPS for 24 hours, as detected by western blot assay. Data were normalized to β-actin. (C) Cell viability after stimulation with 10 ng/mL, 100 ng/mL, or 1000 ng/mL LPS for 24 hours, as evaluated by cell counting kit-8 assay. Panels B and C show representative data for four independent experiments performed in duplicate. Data were analyzed by one-way analysis of variance followed by Tukey’s post hoc test. Columns represent mean ± SD. *P < 0.05, vs. mock group. DAPI: 4’,6-Diamidino-2-phenylindole; IBA-1: ionized calcium-binding adaptor protein-1; LPS: lipopolysaccharide; ns: not significant; TREML2: triggering receptor expressed on myeloid cells-like 2.
