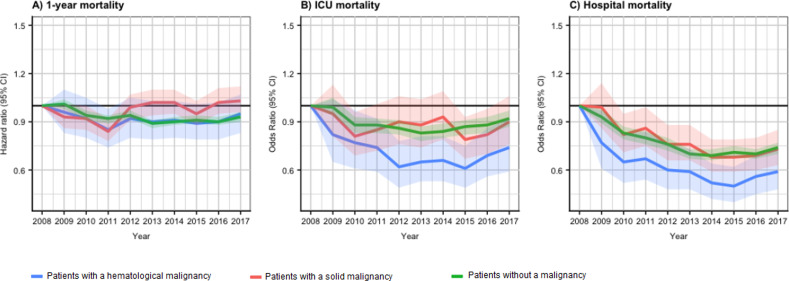
Figure 1.
(A) Shows the trend of hazard ratios (HRs) for 1-year mortality over the inclusion period for the three cohorts (hematological patients, P= .58; solid malignancy, P < .01; patients without a malignancy, P < .01). (B) Shows the trend of odds ratios (OR) for ICU mortality over the inclusion period for the three cohorts (hematological patients, P < .01; solid malignancy, P = .11; patients without a malignancy, P < .01). (C) Shows the trend of OR for hospital mortality over the inclusion period for the three cohorts (hematological patients, P < .01; solid malignancy, P < .01; patients without a malignancy, P < .01). P values are based on a post-estimation Wald test. The actual hazard and odds ratios are available on request from the corresponding author.
Abbreviation: ICU, intensive care unit.

