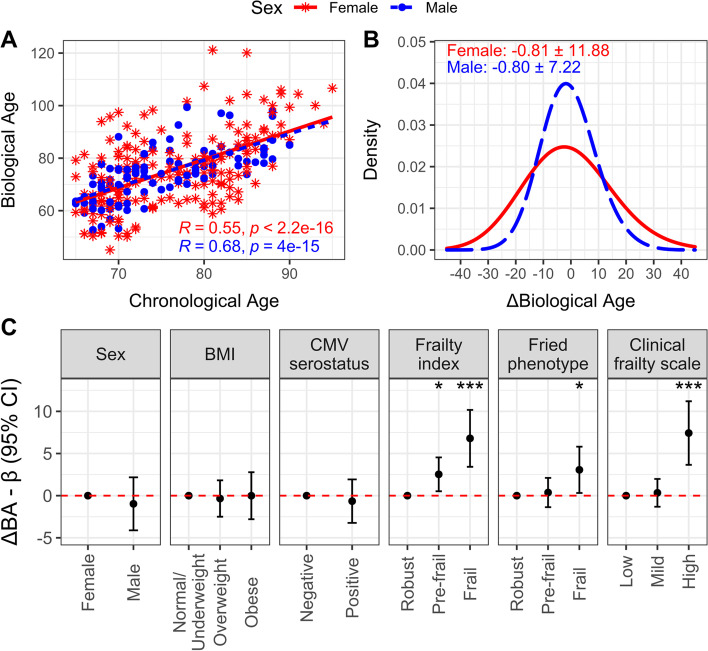
Fig. 1.
Estimation of biological aging in older vaccine recipients. For females (red, asterisks, solid line) and males (blue, circles, dashed line), A Pearson’s correlation (R) of chronological age with biological age (BA) is presented, along with B) the mean and standard deviation of the difference in BA from chronological age (ie. ΔBA). C The difference in BA and 95% confidence interval for categories of health-related factors relative to their reference (ie. the first category shown), was estimated using mixed model regression including a random intercept for participant. ***, p < 0.001; **, p < 0.01; *, p < 0.05

